

Sunday, December 9, 2012
What CNOOC (CEO) Nexen (NXY) Acquisition Means For Oil Sands (China oil companies production reserves offshore)
After months of waiting for the Canadian government to approve it, on December 8, 2012 China's national offshore oil corporation (nyse:ceo) completed a $15.1 billion all cash takeover of Canada's tenth largest oil company Nexen (tsx:nxy). The deal is the largest foreign investment by any Chinese company ever and will undoubtedly be a confidence booster to Chinese firms looking to buy companies abroad after having been spurned by Unocal Corp in 2005 ($18.5 billion offer rejected) . In order to get the Canadian government to approve the deal, CNOOC had to make a few concessions: It agreed to an annual review of its operations, that Nexen Canadian operations employ more Canadian workers than Chinese, CNOOC has also said that it will consider listing on the Toronto Stock Exchange. The stipulations are not new, the Canadian government has a similar arrangement with Rio Tinto Alcan.
Don't be fooled ! Chinese investment in Nexen doesn't necessarily indicate their interest in the oil sands. Nexen only accounts for about 6% of oil sands production (including shale, Nexen produces 52 thousand bpd in Canada), in fact the majority of Nexen's production comes from outside of Canada in regions such as the North Sea, the Gulf of Mexico and offshore West Africa (African production down from 18th boe/d last quarter to nothing this quarter).
Friday, November 16, 2012
Bombardier Results Investor Analysis, Aircraft Deliveries Orders, Flexity Trains cs100 Jets
Bombardier Inc (TSE:BBD.B) is a rare company in that it holds the disctinction of being both the world's largest train maker and the world's #3 manufacturer of aircraft. The Germany-based train division dubbed Bombardier Transportation remains slightly more important to the company financially, however the gap is closing fast; For the nine month period ended October 2011, sales of trains and related services accounted for 53% of company revenue and 59% of ebit - however during the nine month period ended September 2012 that fell to 49.8% and 54%, respectively. Bombardier puts the blame squarely on European demand (lower activity/contracts reaching completion not being filled by as many new ones) which it says accounts for 88% of the decline in rail car sales (9-month period).
I'm still optimistic about the Transportation division ! In China and Russia, demand for trains developed by Bombardier will inevitably go up due to key license agreements signed with major rail equipment companies in China (CSR Puzhen) and Russia (manufacturer Uralvagonzavod). As well, business from North America is on the upswing which bodes well for Bombardier - 3Q revenue from North American customers was $373m (+17.7%) and $1,095m (+7.0%) in the nine month period. Also, revenue from Asia-Pacific which was down considerably during the first two quarters, recovered strongly in the third when it increased by +31.3% qoq (still down -42.9% in 9M2012 but that's due to uncharacteristically low sales in the first two quarters). Total company backlog as of September 2012 is $58.6 billion up +8.7% or $4.7 billion in just the last nine months: 44.5% aerospace, 55.5% trains.

Aircraft revenue is stable, which is a great sign considering more than $200 million worth of aircraft deliveries was postponed until the fourth quarter. The postponement of the CS100 first flight by half a year (Jan 2013 to June 2013) is discouraging but nothing to be too concerned about; The two larger aircraft manufacturerers, Boeing (787 Dreamliner) and Airbus (Airbus A380) ended up releasing their latest larger models three years behind schedule --> Bombardier's 100-149 passenger CSeries planes will compete directly with the Airbus A320 and Boeing 737.
 The company remains a force in the manufacturing industry. Its customer base remains diverse (Saudi Arabia was the biggest rail customer this quarter), it keeps innovating (Learjet 70 and 75 programs launched in May 2012, continuance of Learjet 40 and 45) and getting its jets certified in key geographic regions which gives it a competitive advantage (in June 2012 awarded aircraft type certification for the Q400 aircraft for operation in Russia). There's also the well known fact that Bombardier's new planes are lighter and 20% more efficient on fuel.
Net profit remains stable and orders keep coming in !
I'm still optimistic about the Transportation division ! In China and Russia, demand for trains developed by Bombardier will inevitably go up due to key license agreements signed with major rail equipment companies in China (CSR Puzhen) and Russia (manufacturer Uralvagonzavod). As well, business from North America is on the upswing which bodes well for Bombardier - 3Q revenue from North American customers was $373m (+17.7%) and $1,095m (+7.0%) in the nine month period. Also, revenue from Asia-Pacific which was down considerably during the first two quarters, recovered strongly in the third when it increased by +31.3% qoq (still down -42.9% in 9M2012 but that's due to uncharacteristically low sales in the first two quarters). Total company backlog as of September 2012 is $58.6 billion up +8.7% or $4.7 billion in just the last nine months: 44.5% aerospace, 55.5% trains.
Aircraft revenue is stable, which is a great sign considering more than $200 million worth of aircraft deliveries was postponed until the fourth quarter. The postponement of the CS100 first flight by half a year (Jan 2013 to June 2013) is discouraging but nothing to be too concerned about; The two larger aircraft manufacturerers, Boeing (787 Dreamliner) and Airbus (Airbus A380) ended up releasing their latest larger models three years behind schedule --> Bombardier's 100-149 passenger CSeries planes will compete directly with the Airbus A320 and Boeing 737.
Net profit remains stable and orders keep coming in !
Monday, October 22, 2012
Up and Coming Natural Gas Companies Progress Energy (PRQ) Tourmaline Oil Corp (tse:TOU) Paramount Resources (POU) Intermediate
Over the last two years these rapidly growing companies (five billion dollar Tourmaline Oil Corp is only 4 years old !) weathered the steep decline in natural gas prices, which is quite impressive to say the least; 2012 first half revenues at Tourmaline (+32% --> $204 million), Paramount Resources (-6.2% --> $101 million) and Progress Energy (-12% --> $103 million) all stable despite the huge drop in natural gas price realized: Tourmaline -46.2% Paramount -43.2% Progress -33.5%. What's more, these companies were able to attract the investment (Progress received $1.1 billion from Petronas) necessary to maintain capex spending (-3% Paramount, -22% Tourmaline) at a time when Canada's biggest player, Encana divested $2.2 billion in assets and lowered its 2011 investment plan by -37%.

Yes, the federal government's ruling against the takeover of Progress Energy by Petronas complicates things for investors; for many intermediate gas producers cash flow lags capital, making outside cash (investment) essential for asset development to continue, but I wouldn't be too concerned. Cash flow will experience a natural rise over the coming quarters because natural gas prices are on the way up ! +73% in just the last six months.
Friday, October 5, 2012
Seabridge Gold (SA) Hecla Mining Company (HL) May Draw Interest; reserves,production,mining
Seabridge Gold (tsx:sea) and Hecla Mining Company (nyse:hl) are two companies that investors can't seem to figure out. Prior to the temporary shutdown of Lucky Friday, Hecla was one of if not the largest pureplay silver producer in the United States. After the Lucky Friday incident, investors fled the company resulting in an immediate loss of 30% of its silver output, half of its lead output and some of its reputation. But today, Hecla is reporting not only that it will restart Lucky Friday within half a year but also that it will be expanding it with the construction of a fourth shaft which will lengthen mine life, possibly to 30 years. With $233 million in cash equivalents Hecla is also active in the M&A department; Hecla laid out $110 million for US Gold & Silver back in July 2012 (which was turned down). The bad news for the company ? Total operating expense last quarter was steady with the previous four quarters even though revenue was way down (averaged $108.105m over those quarters but just $67.02m in the last). Not all was bad though, Hecla did manage to double dividends q2q (2c per share up from 1c despite eps being only 1c).
Seabridge Gold really is A gold mine !

Ivanhoe Mines potential ?
Ivanhoe Mines (now Turqoise Hill Resources) more than quadrupled in value after Rio Tinto took interest in it. Whether or not Seabridge does the same the fact remains it controls 100% of what will someday be Canada's largest gold mine.
Three days after releasing the last quarterly report, on September 5, 2012 Seabridge released data from exploration drilling done last summer. Drilling revealed veins with the highest gold grades found to date ! The findings are sure to bring KSM's 2P gold reserves closer to 40 million ounces (was 38.2m according to last estimate done). Over the entire deposit, the average gold grade is 0.55 grams per tonne but at a 2 meter intercept, one of the newest holes drilled revealed 66.7 grams of gold per tonne in addition to 287 grams of silver !! (average grade over the entire hole was 8.94 g gold, 41.6g silver).
Seabridge also revealed that it is only focused on KSM and Courageous Lake which is why it's in the process of divesting all other assets (big chunk let go last quarter in Red Mountain Project) but don't be fooled into thinking it's letting go of all other interests; When it sold Red Mountain and various Nevada projects, in addition to cash Seabridge Gold received more than 4 million shares of each company. So, when those other projects pan out (no pun intended) Seabridge will realize even more in return not that it isn't already giving investors a healthy return (sept 5 - oct 4 : +15.05%, july 5 - oct 4 : +30.16%). Bad News: No production means no dividends.
Watch Out ! Seabridge Comes With Risks
Core assets Kerr-Sulpherets-Mitchell (BC) and Courageous Lake (NWT) are located in regions where aboriginal groups also have land. The First Nations people could be entitled to key land and thus other agreements may need to be reached. Shifts in political conditions and/or regulations (environmental laws, tax laws) could impact the company's ability to continue developing either project. Right now though everything appears to be stable and, considering exploration at KSM has been ongoing for more than six years without any major disputes, I'd say the rewards outweigh the risks.
Notes: Last quarter, cash resources declined by -$19 million due to advancements at KSM and Courageous Lake - Courageous Lake 2P reserves surpass 6 million ounces - All of KSM's 10.3 million ounces of proved reserves reside in the Mitchell open pit deposit (including probably it's 27.5m) - 10.2 million ounces in probable gold reserves must be mined from a block cave (Mitchell 7.4m, Iron Cap 2.8m) - Iron Cap is the newest of the four deposits (added May 2011).
Hecla Mining Company
Hecla stock price has been on the upswing since September 13, 2012 (+10% that day while adding modestly to that gain since then). On August 7, 2012, the week before it acquired an interst in Dolly Varden Corporation, Hecla Mining Company reported on the 1st half / 2nd quarter of 2012. The results were mixed; On the one hand Greens Creek produced less: 1.365043 million ounces of silver down from the previous year (1.5m ounces), steady with the previous quarter (1.328704m oz) while on the other hand the cash cost per ounce of silver produced was down significantly from the prevous quarter ($2.24 --> $1.03 /oz). So why the 49.7% q2q drop in gross profit ? A couple reasons; Average realized silver price down -26.1% between last two quarters (1st and 2nd) $36.59 --> $27.05. Production was steady but payable ounces was not;
Payable silver sunces sold: 1,133,764 oz (-39.7% vs 2q11, -20.6% vs 1q12). Gold, lead, zinc
Monday, September 3, 2012
20 Largest Banks & Financial Institutions in the World Globally as of September 3, 2012 (revenue, assets, deposits, hsbc, icbc, fiscal, capitalization)
Banks are ranked by most recent financial data, revenue, assets, earnings, market value. TD Bank data is from the February to July 2012 period. % change in market value over the last year represents the change in total market value. When USA, NYSE, or ADR is shown it means the stock value was already in USD. Just missed the list: Unicredito Italiano (Unicredit Group), Assicurazioni Generali (Generali Group), Royal Bank of Canada.
A lot has happened since my last report on the banks exactly one year ago. In May 2012 JP Morgan's CEO announced that faulty derivatives trading caused the bank to lose more than $2 billion. The news sent the stock reeling, in after hours trading that day the company lost more than 11% of its market value. The loss is significant because that's about the same amount of market cap that separated it from the other top valued financial institutions.
Canadian banks are aggressively pursuing acquisitions ! Between 2008 and May 2012 Canadian banks spent $37.8 billion on ~100 acquisitions which is impressive considering big banks like Citibank and BNP Paribas were trying hard to sell off assets. To put things into perspective, between 2001 and 2008 Canada's six big banks spent $38.0 billion on acquisitions meaning that today they are spending at roughly twice the rate they used to. One thing to consider though is the fact that a lot of their recent acquisitions bolster their position in Canada rather than overseas; 95% of the purchases they made between 2001 and 2008 were abroad. So far in 2012 some of the biggest Canadian deals were made by TD Canada (acquisition of MBNA Canada) and more recently the Bank of Nova Scotia (August 31, 2012 closes deal with ING Groep for ING Canada, paying only $1.9 billion net in cash for 3% of the Canadian market for retail banking). ING used the money to help pay off a government bailout it received a few years ago. That's pretty much it for ING in Canada, if you remember, back on May 13, 2009 ING sold all of its share in ING Insurance to institutional investors for $2.2 billion. Today, that 70% share is worth about $5.5 billion. Why is ING so eager to get out of Canada ?

In China, payment delays are becoming more problematic especially in the mining sector (debt owed to machinery companies up significantly). That's causing headaches for the big four banks there which have seen their market capitalization drop off quite a bit from last year's highs. More of the loans on their books are becoming risker and investors are taking notice.
Royal Bank of Scotland: I excluded it from my list last year and again this year. This year the bank's problems go beyond just the unending quarterly losses. The company's market value remains pennies on the dollar at just over US$20 billion which is lower than it was at this time last year. The bank remains mired in problems which include conflicts of interest, rigging of inter-bank borrowing, IT malfunctions, problems in Ireland. The bank's market cap has been erratic as of late. It's also 83% owned by the British government.
World's 21 leading financial institutions with data from last six months as quoted in company reports (using domestic currency): click on link for company interim 2012 report (in the case of TD Bank it's the 2nd + 3rd qtr ending July 31, 2012)
| Bank | Assets | Revenue | Net Income | ||||||
|---|---|---|---|---|---|---|---|---|---|
| June 2012 | June 2011 | % chg | 1H12 | 1H11 | % chg | 1H12 | 1H11 | % chg | |
| ICBC | 16,431,196 (mar'12) | 14,896,048 | +10.3% | 258,900 | 231,160 | +12.0% | 123,200 | 109,600 | +12.4% |
| HSBC | 2,652,334 | 2,690,987 | -1.4% | 43,672 | 42,311 | +3.2% | 9108 | 9762 | -6.7% |
| ConstrBank | 13,505,745 | 11,754,766 | +14.9% | 227,812 | 197,246 | +15.5% | 106,494 | 92,953 | +14.6% |
| JP Morgan | 2,290,146 | 2,246,764 | +1.9% | 48,232 | 52,000 | -7.2% | 9884 | 10,986 | -10.0% |
| AgriBank | 12,112,888 | 10,725,141 | +12.9% | 210,780 | 184,633 | +14.2% | 80,522 | 66,679 | +20.8% |
| BO China | 12,825,590 | 11,483,498 | +11.7% | 179,665 | 165,974 | +8.2% | 75,002 | 70.234 | +6.8% |
| Citigroup | 1,916,500 | 1,956,600 | -2.0% | 38,048 | 40,348 | -5.7% | 5877 | 6340 | -7.3% |
| BO America | 2,190,868 | 2,338,826 | -6.3% | 44,246 | 40,113 | +10.3% | 3116 | -6777 | up |
| TD Bank | 806,283 | 713,642 | +13.0% | 11,591 | 10,540 | +10.0% | 3396 | 2894 | +17.3% |
| Itau Unibanco | 888,809 | 793,679 | +12.0% | 40,183 | 35,821 | +12.2% | 6729.8 | 7132.5 | -5.6% |
| Santander | 1,292,677 | 1,231,908 | +4.9% | 22,544 | 21,403 | +5.3% | 1704 | 3501 | -51.3% |
| AIG | 555,383 | 610,427 | -9.0% | 35,566 | 34,119 | +4.2% | 5788 | 3554 | +62.9% |
| BNP | 1,970,041 | 1,983,154 | -0.7% | 19,984 | 22,666 | -11.8% | 5082 | 5246 | -3.1% |
| Goldman Sachs | 948,638 | 936,910 | +1.3% | 16,575 | 19,175 | -13.6% | 3071 | 3822 | -19.6% |
| UBS | 1,412,043 | 1,419,162 | -0.5% | 12,934 | 15,515 | -16.6% | 1252 | 2822 | -55.6% |
| Lloyds | 961,371 | 978,951 | -1.8% | 8,965 | 10,868 | -17.5% | -641 | 2278 | up |
| Barclays | 1,631,265 | 1,492,922 | +9.3% | 15,475 | 15,299 | +1.2% | 480 | 1983 | -75.8% |
| Deutsche | 2,241,174 | 2,164,103 | +3.6% | 17,214 | 19,014 | -9.5% | 2063 | 3363 | -38.7% |
| ING Groep | 1,237,248 | 1,240,731 | -0.3% | 7,759 | 7,137 | +8.7% | 1851 | 2888 | -35.9% |
| IntesaSan | 666,417 | 644,673 | +3.2% | 8944 | 8720 | +2.6% | 1274 | 1402 | -9.1% |
| SocGen | 1,246,666 | 1,158,008 | +7.7% | 12,583 | 13,122 | -4.1% | 1405 | 1897 | -25.9% |
Highlights and Some Key Data To Keep In Mind:
Industrial and Commercial Bank of China
Revenue growth outpaced growth in operating expenses (13.7% vs 12.6% for the half) and that pushed the cost to income ratio down to 25.57% which is a first half record low. EPS 0.35 RMB up from 0.31 RMB qoq.
On July 6, 2012 ICBC announced the closing of the acquision of 80% of the Bank of East Asia, a deal that gave it a foodhold in the US market.
By June 30, 2012 ICBC middle east operations already surpassed their 2011 full year earnings.
S&P has a slightly higher rating of the bank vs Moody's (outlook positive vs stable).
June 2012: ICBC is present in 34 countries, overseas asset value at US$ 166.6 billion +33.6% since December 2011.
Banco Santander
Profit from continuing operations was €3472m down only 11.9% from (€3940m). The real profit decline of 51.3% --> €1704m is due to the setting aside of €1,304 million in the 2Q12 in provisions for property (real estate exposure in Spain); That reduced 2Q12 net income from €1,404 million --> €100 million.
American International Group Inc. AIG
Insurance premiums contributed 53.6% of revenue ($19,080m / $35,566m) which is down from 56.8% in 1H2011 ($19,380m / $34,119m)
Deutsche Bank
In euros, assets (+3.56%) and deposits (+0.61%) went up in value but because the euro lost -8.19% of its value relative to the USD when denomited in dollars both experienced a decrease in value.
Societe Generale
Asset value actually went up +7.66% however the euro lost -8.19% of its value relative to the USD and that caused SocGen asset value to fall slightly when denominated in dollars.
Agricultural Bank of China Breakdown of Customer Deposits
June 30, 2012: 53.4% are demand deposits (28.3% individuals / 25.1% corporate), 41.4% time deposits (39.8% individuals / 11.6% corporate), rest are other.
June 30, 2011: 57.4% demand deposits (28.6% individuals / 28.8% corporate), 38.9% time deposits (28.7% individuals / 10.2% corporate), the rest are other.
Revenue is quoted as operating income, customer deposits are referred to as Due to Customers.
China Construction Bank
EPS basic and diluted are the same, 0.43 rmb up from 0.37 rmb
The bank's cost to income ratio down to 32.73 from 36.19 year ending December 31, 2011
Customer deposits breakdown: June 30, 2012: 51.2% are demand deposits (18.3% personal / 32.9% corporate), 48.8% time deposits (27.9% personal / 20.9% corporate), rest are other.
June 30, 2011: 53.5% demand deposits (18.5 personal / 35.0% corporate), 45.2% time deposits (26.7% personal / 18.5% corporate), the rest are other.
Toronto-Dominion Bank
TD's 3Q2012 was one of the best on record; EPS (basic) up to $1.92 from $1.84 in 2Q2012, $1.77 in 3Q2011. Though the company's bottom line was much improved, it didn't result in any dividend hikes (still at 0.72 q2q, but up from 0.66 last year).
For the recent third quarter wealth and insurance net income was +3.15% --> $360 million (21.1% of total group profit).
In just the last 3 months TD's total assets are up +4.28% !
Revenue grew +1.6% between April 2012 (2q) and July 2012 (3q) compared to 5.2% between April 2011, July 2011.
Only 16% of its wealth and insurance net income comes from its ~ 30% stake in TD Ameritrade.
In 2012 TD acquired MBNA Canada.
About the table at the top of the article, currencies used*Average fx rate calculated myself using data at x-rates.com and google finance exchange.
Exchange rates used to convert to USD for the 6-month period (used for customer deposits, revenue, net income/profit)
Chinese RMB 1hfy12 0.158243255555, 1hfy11 0.1529334634 up 3.47%.
Euro 1hfy12 1.29745937777, 1hfy11 1.403703906 down 7.57%.
Swiss Franc 1hfy12 1.07705781666, 1hfy11 1.10659625 down 2.67%
Brazilian Real 1hfy12 1.86424560555, 1h11 1.6312765625 down 14.28%.
British Pound 1hfy12 1.57693847777, 1hfy11 1.61702795275 down 2.48%.
Canadian Dollar 1hfy12 1.00605145856, 1hfy11 0.9704058232 down 3.67%
Currencies used for assets last day of most recent reporting period
Chinese RMB June 30: 2012 6.3550, 2011 6.46350
March 31, 2012 6.29700 (ICBC)
Euro June 30: 2012 1.266350, 2011 1.451931
Swiss Franc June 30: 2012 0.947650, 2011 0.84160
Brazilian Real June 30: 2012 2.00950, 2011 1.560491
British Pound June 30; 2012 0.636679, 2011 0.62250
Canadian Dollar July 31: 2012 0.955100, 2011 0.955100
Thursday, August 2, 2012
Possible US Energy Crisis Looming ? (oil, distillate inventories, oil company production, Exxon Mobil XOM)
In 2012 57 coal generators representing 2.8% of America's coal fired energy capacity will be shut down with another 118 shutdowns slated for retirement in the years to come. In November 2011 coal's contribution to energy generation dipped below 40% for the first time since the 1970's. A big reason for the shutdowns is the costs associated with making them more eco-friendly (costly carbon emission credits in addition to new federal laws requiring that all be fitted with new emission reducing technology such as nitrogen scrubers). In California, coal utility plants face even more obstacles; Some of the newest energy laws in California literally make it impossible for utility companies to continue using coal to generate electricity by disallowing the renewing of contracts (Edison International is one of many victims).
Keep in mind that all this is happening despite the fact that the United States is home to 28% of the world's coal reserves and that China is building dozens of new plants each year.
Note: In the March 2012 quarter, US carbon emissions were at a 20-year low of 1.340 billion metric tonnes. Coal-sourced carbon emissions dipped below 400 million metric tons for the first time since the mid 1980's (387 Mt down -18%).
Petroleum - Oil - Natural Gas

On August 1, 2012 the US Energy Administration reported that oil stockpiles were down on the week by the largest margin in over half a year; US stockpiles of crude oil fell -6.5M barrels to 373.6M barrels (however vs this time last year crude oil stockpiles are up +18.6M barrels). More disturbing though is the long term downward trend in US stockpiles of distillate (usable gas for fuel); Distillate stockpiles are 28 million barrels lower than they were at this time last year (152.3M --> 124.3M) after declining by another million barrels last week (week to week, finishing at 124.3M barrels).
The US still imports almost 45% of the oil it consumes and its domestic reserves rank next to China's (19 billion vs 14 billion barrels) so maybe it's time American oil companies do what Chinese companies are already doing, which is acquire foreign assets ! (CNOOC takeover of Nexen, Talisman sells $1.5B worth of assets in the UK). Note: Nexen's proved oil reserves are similar to Anadarko's (2-2.5 billion boe).
According to the EIA on July 30, 2012 American gas pump prices were lowest in the Gulf Coast ($3.31 per gallon) and highest on the West Coast ($3.71 per gallon).
June 2012 breakdown of US gas price: taxes 12%, distribution and marketing 14%, refining 12%, crude oil 62%.
Regular gasoline average price: $3.54/gallon, diesel $3.76/gallon; US gas prices today are about 50c/gallon lower vs the 6-month high.
Oil Companies
As shown in the graph, America's 3 biggest oil companies are producing less while the relatively smaller companies are the ones adding to output. Furthermore, Anadarko Petroleum, considered by many to be the fourth largest US-based oil company, is suffering from assets writedowns (could cause the company to devalue which would make it a takeover target, bad news considering US companies need to be more aggresive with regards to foreign takeovers).
Quarter ended June 2012
Of the six regions that Exxon operates in only the Canada/South America region showed an increase in oil liquids production (240 --> 243 th boe/d). Exxon gets 37.6% of its natural gas output from Asia (ahead of the USA at 33.4%).
Occidental Petroleum net income down -27%
El Paso Corp: avg realized sales price up +18.0% for oil/condensate ($86.27 --> $101.81) but down 28.6% for natural gas ($4.06 --> $2.90) and down -18.7% for ngl's ($50.37 --> $40.96).
Anadarko reported a -$380M loss on $978M in writedowns of its coalbed-methane natural gas assets. Anadarko has interests in some of America's biggest shale resource plays including Marcellus and Eagle Ford but the writedown concerns other properties in Wyoming's Powder River Basin.
Unstable Natural Gas Prices Lead Companies To Abandon Shale Projects --> US Reserves Of Shale Go Down
Tuesday, July 3, 2012
Research in Motion (RIMM) Down But Definitely Not Out (undervalued techstocks, competition, blackberry 10)
Research In Motion sold 260,000 playbooks between March 3 and June 2 of 2012 which though down quarter to quarter, is still one of the best quarters for tablet sales since their launch one year ago (500,000 in 4q12, 150,000 in 3q12, 200,000 in 2q12 & don't forget that playbook now owns 15% of the Canadian tablet market up from 5% in early 2011); Also, keep in mind that the less popular 16 GB playbook is being discontinued. RIM has yet to unveil the rumoured 10 inch model meaning that the company literally had NOTHING NEW to offer last quarter but still did reasonably well on the sales front. Only recently has the company allowed blackberry messenger users to view facebook and twitter updates so the full impact of that on sales won't be realized until another quarter. Remeber also that earlier this year sales of BlackBerry phones rebounded strongly after one of the worst quarters in company history.
Signs pointing to a recovery in stock price: July 2, 2012 Hudson Square upgrades RIMM to buy from hold consequently establishing a price target of $10 or 33.9% higher than now (July 3 start of trading). Also note that Lazaridis, one of RIM's biggest shareholders with 30M shares or 5.6% of the company (last major purchase was for 3.1M shares back in February) has not been a seller, indicating his confidence in a recovery. Oct 31 through Nov 4 share price up +14.5% to $8.71 giving it a market value of $4.56 billion (Nokia up +3.0% to $2.80).
September 2012 Update: For the three months ended September 1, 2012 Research In Motion posted better than expected results. Although the company's bottom line remains in the red at -$235 million or -$147 million adjusted (27c/share) the loss is 43% lower than the expected -47c/sh. In the two quarters prior RIM lost $518m (-99c/sh) and -$125m (-24c/sh) respectively. Despite not releasing any new products, RIM's quarterly revenue was up +2.10% from the previous quarter at US $2.873 billion. Negatives : 2013 second quarter cash flow was only $432 million $278 million less than in the previous quarter. Shipping volume for smartphones was 7.4 million down -5.1% from the previous quarter. As of September 2012 BlackBerry subscriber base is 80 million (+2 million last three months).

$2.2B in cash equivalents + short & long term investments = $100M more than it was at the end of the previous quarter. That means that in the short term, RIM does not have to part out portions of its business (like Nokia is doing with Microsoft) to survive (why I especially don't think the company will give up either of its two core units, hardware or services, afterall it didn't consider selling either six months ago when the stock was worth 60% more).
The adjusted earnings loss in this first quarter of 2013 is actually a first for RIM (-$192M or -37 cents a share). In the prior quarter adjusted net income was actually $418 million which isn't bad considering Nokia went through a number of quarterly losses before investors punished the stock.
Subscriber base up +1M to 78 million giving RIM's cash flow a stronger foundation.
The last two quarters provided a combined unadjusted net loss of $643M only about a third as much as Nokia ($2.01b) even though RIM launched NO new products but Nokia had its Lumia 900 (2 million units sold up from 1 million last year).
Research and Development spending was almost identical to the November quarter of 2011 ($368m) but down only slightly q2q from $386m (March 2012 quarter), not bad considering it had 33% less revenue to work with ($2.8b vs $4.2b). Services (bbm, etc) accounted for 36% of revenue up from 27% in the previous quarter.
Research In Motion is trimming its workforce by about 5000 but that includes job cuts through to the end of 2013 (the quarter BB10 is released) so the good news here is that this is rock bottom ! Job cuts will save the company one billion dollars a year.
BlackBerry Jam (began last month, May 2012) aims to improve blackberry app world by bringing together industry leading application developers in order to help them innovate and get their products to market faster (one of the attractions for app developers is the fact that the top 10% of vendors are making more money at BB app world than at Android or even Windows).

Including the half a billion dollar loss in this quarter, RIM profited +$556 million over the last 4 quarters, so operating losses are still relatively new (by contrast Nokia lost -2.437b in 52 wks ending March 2012).
RIM sold $1.6 billion worth of devices (7.8M/260th playbooks); Nokia sold $4.2 billion worth of devices (83M cellphones, 12M smartphones). Nokia avg selling price for devices: €51, RIM avg selling price: ~ $200.
RIM's enterprise server/security platform (playbook first to be approved by the US government) basically makes it a major player in the corporate market regardless of how well developed or freely accessible its app market is (BlackBerry used by 90% of fortune 500 companies, on June 26,2012 the UK government approved use of blackberry security software important since the blackberries now offer mobile voice solutions; this is just one of many such approvals the long term positive effects of which are enormous).
In the latest quarter RIM shipped 7.8 million smartphones which is only 3.1 million less than Nokia (by contrast at this point last year the difference was closer to 10 million). 7.8 million is low but not THAT bad considering sales weren't that much higher at 10.6 million in the quarter nine months ago (and recovered in the following quarter when sales improved to a near record high of 14 million). It made $1.652 billion from the sale of 7.8 million phones and 260,000 playbooks. Comparing that to the $3.066 billion it made in 2q12 from the sale of 10.6 million phones and 200,000 playbooks indicates that the average selling price of a BlackBerry went down since then. I'd put the average playbook price at about the same as the phone (remember, the company now sells playbooks at $199-$299 down from over $500 earlier last year). That comes out to around $206 per device or 29% lower than the average selling price of a blackberry 7 phone earlier in the year according to Abramsky. You have to think, how much profit can RIM make from the next generation phones ? especially considering the vast amounts of features they're going to have.
Refering to the BB10 phones CEO Thorsten Heins said that he's confident they'll provide "a ground-breaking next generation smartphone user experience". The delay in launch is due to the time consuming process of integrating key features which RIM has had success developing (main carriers of the BB are more than satisfied with the platform).
Financials : The Bad News
If you're an investor then be prepared for a wild ride over the entire fiscal 2013 period, and it's only the 2nd quarter ! Operating losses, though still new at RIM, won't end until after we witness the consumer markets response to BlackBerry 10 qnx phones. That's quite a risk to take considering you're going to have to support a company bleeding money for the next nine months and then you have to hope that BB10 (aka BBX) will be THE gamechanger (by that time a slew of new android phones will have already hit the market, each better than the last).
If it were me, I'd take the risk. You see, it was only last month that the US military committed to buying more blackberry devices, which instantly validates the company's security, platform and features. The military, among other DoD and enterprise customers, was particulary impressed with enhanced features on the newest model 7 phones (near field communication technology/voice activated search) and with mobile payments facing increasing scrutiny from government lawmakers, blackberry's devices are already government approved (security) and that could mean a lot in the future.
Monday, July 2, 2012
Sobeys (EMP.A) Did Well in 2012 Even Compared Loblaw Companies LTD (L), Metro Inc (MRU.A)
Empire Company Ltd (tsx:EMP.A) is the parent of Sobeys Stores Limited, the food retailing unit which contributes 99.0% of revenue to the Empire Group (up from 98.3% in 2011 due to the divestment of Wajax property business but that will change next year due to the inclusion of 236 more gas stations as part of operations). Empire Company is still looking like a solid investment (ebitda margin grew the most out of the three companies however it's still in 3rd place at 5.5%).
It upped its dividend payout to 24 cents a share from 22.5 cents which represents an impressive +6.7% jump (had been 20c for a number of quarters prior to that). That beats Loblaw companies LTD last quarterly dividend payout of 21 cents a share back on April 30, 2012 (no growth quarter on quarter) and 21.5c at Metro Inc (up 12.0% from 19.2c which is a nice return). Metro had no problem hiking dividends, with earnings per share up +12 cents (82-->94c) compared to +14 cents at Empire Company (121-->135c) and -13 cents cents at Loblaw Companies Ltd (58-->45c).
Same store sales: Metro 2Q12 (March 2012) +1.0%; Loblaw Companies (march 24, 2012) -0.7%, Empire Company (June 2012) +0.7%

Although sales were down slightly in the last quarter of 2012 (-1.8%), after accounting for the period length being 1 week shorter empire's total sales were actually up +3.0% or $474.9 million (fiscal 2012 only 52 weeks vs 53 weeks in fiscal 2011). Sales were also +3.0% higher for the year after accounting for 2011's extra week & the impact on sales resulting from acquisitions & divestments of convenience stores/gas stations (sales difference between 2011 and 2012 goes from $290m --> $474.9m). Empire Company's EBITDA (unadjusted) ended 2012 on a strong note, up +$14.4m over last year's quarter compared to only +$13.6m for the entire fiscal year (meaning it actually contracted over the previous three quarters). In 4q12 only $10m ($35.3m for the year) in profit came from investments and other operations up from $6.5m in 2011. In the thid quarter, Sobeys food business contributed $3.94 billion to revenue (out of Empire's $3.98b) while in the fourth quarter it was $4.02 billion (out of Empire's $4.07b) which is about 99.0%. In terms of profit, Sobeys was the source of only 89.54% of Emipre's over the last two quarters.
Ebitda margin for last quarter; Metro Inc still leads the industry at 6.9% (up from 6.7%), Loblaws is still in second place at 5.9% (down from 6.6%); Empire Company, though last went up more than the other two: 5.5% (up from 5.06%).
 Business at Empire Theatres appears to be strong with revenue from Empire's non food business up +7.2% to $50.6m (from $47.2m); Most of the revenue in that category comes from cinema operations. For fiscal 2012, that revenue reached $204.5m up from $200.5m.
$10M in ebitda gains in fiscal 2012 are attributed to 'dilution gains' from a change in ownership level of Crombie Reit. Normally it's $74.8m (vs $69.4m) but that changes to $64.6m (vs $62.6m) after removing items not considered part of underlying business.
Funded debt fell -$21.6m to just over $1.1 billion (1.3xebitda). Funded debt/total capital fell -1.7 basis points to 25.0%.
Market Share
If we base the market share each has in Canada's food retailing industry on the food revenue of each company during the last two quarters, we can assume Sobeys is at 23% if we believe Galen Weston Sr (Loblaw Companies) when he puts his company's share at 40% (Sobeys sales last six months $7.9632 billion vs Loblaws $14.034 billion last two reported quarters ending March 24). It follows that Metro Inc has 15% of the market (all of its revenue comes from food).
More information about the grocery industry can be found at another website I launched recently at www.grocerynews.org
Sunday, June 17, 2012
Empire Company LTD (EMP.A) Will Marc Poulin Be Able To Fill Bill McEwan's Shoes As President Of Sobeys ? (Loblaw Companies LTD (L), grocery market competition)
The February 8, 2012 announcement from Empire Company Limited concerning the retirement of Sobeys CEO Bill McEwan came as no surprise to those already aware of his recent health problems, but that doesn't mean there won't be a difficult transition period. Bill McEwan was instramental in growing the company's business both in its size and market penetration (in just the last two years FreshCo was launched followed by full-service next generation IGA stores in Quebec and Ontario). He oversaw implementation of the company's development growth strategy which thus far has been a success. Sobeys went from being mostly just an Atlantic grocer to one with a Canada-wide reach (881 of its 1337 locations are in Ontario, Quebec and Alberta). It was just after he joined in 2000 that Sobeys parent, Empire Company purchased most of the interest it currenty has in Genstar Development Partnership (real estate, at present Empire owns 40% of Genstar only marginally higher than the 35.7% acquired in January of 2001; Genstar is now a bigger part of the company's real estate business since the divestment of Wajax last year).
Mr. McEwan was also instrumental in getting deals done with Target (will supply the chain with private label food products) and Shell (Sobeys not Empire Company made this deal; acquired 250 of Shell's 1,600 Canadian gas stations. That's in addition to the dozen or so Fast Fuel locations already run by Sobeys Atlantic). In fact even Sobeys private label (Compliments) was launched in the middle of his tenure; The brand now includes a portfolio of five distinct product lines; Balance, Organic, Sensations, Greencare in addition to Compliments, which is vital considering main competitor Loblaw Companies has seen demand for its own Green Leaf organic products surge.
 For a grocery chain that added more than +$200M to operating income, +$6B to sales and pushed parent company Empire's dividends past 80 cents a share, Bill McEwan's generous compensation ($1.9M cash bonus in 2010 in addition to a 3.8% raise) is easy to justify. Only two years prior to making him CEO, Sobeys completed the takover of IGA's parent company the Oshawa Group, in a mega deal that more than doubled sales; That added another dimension to his new job, tasking him with integrating the two companies, does he convert IGA into Sobeys stores or not ? what about Price Choppers? He left the brands intact except for Price Choppers, but that's a different story. Price Chopper locations are gradually being replaced by FreshCo which also markets itself as a discount retailer, meaning they will continue to attract the same type of customers. Sobeys is about half as big as Loblaws (sales) the same as it was back in 2000, but remaining the second largest in what has become an ultra-competitive industry is itself impressive.
His story is remarkable to say the least. He started out bagging groceries at a Ferraro supermarket as a teenager in British Columbia. At around 18, he entered university and began studying Arts before cutting his studies short two years later, opting instead to go back to work at the supermarket. His passion for the food business gave him unique insight as well as put him in contact with the right people and by the 1990's he was a vice-president at A&P in the United States.
His job won't be easy; Food price inflation especially for meats (record high and going up) means Sobeys will eventually be forced to raise prices more than customers are accustomed to (2Q2011: Sobeys prices decline -1% even though cost of goods actually went up). Sobeys has not yet raised prices the way it would have liked and that's because of an unprecedented amount of promotional discounting also known as 'disinflation' attributable to intense competition. Not helping the situation is Wal-Mart which now carries more grocery food items than it did a year ago.
Bill McEwan has routinely been awarded top tier industry-level recognition. In 2005 he received the Global Pencil Award. In 2009 supermarketnews named him a top 75 food retailing executive and on April 10, 2012 the Retail Council of Canada gave him the lifetime achievement award (highest award in Canada). The leadership change will become become official on June 29, 2012.
Also of note:
- Empire Company's current president Paul Sobey took over the reigns of the company in 1998, only two years before Bill McEwan joined so it'll be interesting to see if his departure leads to any changes at Empire's board.
- On April 26, 2007 Sobeys and Empire Co officially become one company (Empire) after Sobeys agreed to be bought out for $1.06B (72.1% --> 100%). So until 2006 Sobeys annual report statements were made by itself not part of Empire Company reports.
To those of you who visit my site regularly looking for new posts I apologize for not writing as much lately. I've had a busy couple months and am getting ready to launch a couple new websites. One of them is grocerynews.org (already started but has a lot of work ahead) and the other one I'm working on will be located at techstocks.co (.co not .com). Thanks for visting and appreciate the comments !
Mr. McEwan was also instrumental in getting deals done with Target (will supply the chain with private label food products) and Shell (Sobeys not Empire Company made this deal; acquired 250 of Shell's 1,600 Canadian gas stations. That's in addition to the dozen or so Fast Fuel locations already run by Sobeys Atlantic). In fact even Sobeys private label (Compliments) was launched in the middle of his tenure; The brand now includes a portfolio of five distinct product lines; Balance, Organic, Sensations, Greencare in addition to Compliments, which is vital considering main competitor Loblaw Companies has seen demand for its own Green Leaf organic products surge.
 For a grocery chain that added more than +$200M to operating income, +$6B to sales and pushed parent company Empire's dividends past 80 cents a share, Bill McEwan's generous compensation ($1.9M cash bonus in 2010 in addition to a 3.8% raise) is easy to justify. Only two years prior to making him CEO, Sobeys completed the takover of IGA's parent company the Oshawa Group, in a mega deal that more than doubled sales; That added another dimension to his new job, tasking him with integrating the two companies, does he convert IGA into Sobeys stores or not ? what about Price Choppers? He left the brands intact except for Price Choppers, but that's a different story. Price Chopper locations are gradually being replaced by FreshCo which also markets itself as a discount retailer, meaning they will continue to attract the same type of customers. Sobeys is about half as big as Loblaws (sales) the same as it was back in 2000, but remaining the second largest in what has become an ultra-competitive industry is itself impressive.
 His story is remarkable to say the least. He started out bagging groceries at a Ferraro supermarket as a teenager in British Columbia. At around 18, he entered university and began studying Arts before cutting his studies short two years later, opting instead to go back to work at the supermarket. His passion for the food business gave him unique insight as well as put him in contact with the right people and by the 1990's he was a vice-president at A&P in the United States.
Now onto Marc Poilin, who is he ? For starters, he has a masters degree in business (though Bill McEwan did more than alright without one), has 26 years experience in the food retailing business (started out with Provigo - now owned by Loblaws) and 1 year experience as president of a major grocer (IGA).
His job won't be easy; Food price inflation especially for meats (record high and going up) means Sobeys will eventually be forced to raise prices more than customers are accustomed to (2Q2011: Sobeys prices decline -1% even though cost of goods actually went up). Sobeys has not yet raised prices the way it would have liked and that's because of an unprecedented amount of promotional discounting also known as 'disinflation' attributable to intense competition. Not helping the situation is Wal-Mart which now carries more grocery food items than it did a year ago.
Bill McEwan has routinely been awarded top tier industry-level recognition. In 2005 he received the Global Pencil Award. In 2009 supermarketnews named him a top 75 food retailing executive and on April 10, 2012 the Retail Council of Canada gave him the lifetime achievement award (highest award in Canada). The leadership change will become become official on June 29, 2012.
Also of note:
- Empire Company's current president Paul Sobey took over the reigns of the company in 1998, only two years before Bill McEwan joined so it'll be interesting to see if his departure leads to any changes at Empire's board.
- On April 26, 2007 Sobeys and Empire Co officially become one company (Empire) after Sobeys agreed to be bought out for $1.06B (72.1% --> 100%). So until 2006 Sobeys annual report statements were made by itself not part of Empire Company reports.
To those of you who visit my site regularly looking for new posts I apologize for not writing as much lately. I've had a busy couple months and am getting ready to launch a couple new websites. One of them is grocerynews.org (already started but has a lot of work ahead) and the other one I'm working on will be located at techstocks.co (.co not .com). Thanks for visting and appreciate the comments !
Thursday, May 24, 2012
Amec plc Is A Solid Company Built On Growth (LON:AMEC, Mactec, Urenco, BP, Clean Energy, Energy Investments, Earth & Environmental)
Here's a stock that should appeal to the pernickety investor, London-based engineering group Amec (LON:AMEC). The company is an important player in both the nonrenewable (oil & gas) and renewable (nuclear & other clean energies) sectors; It provides services ranging from oil rig maintenance to water supply management of municipal acquifers and conservation strategies to nuclear power plant decommissioning and other safety services.
 What makes the company solid is the fact that the services it provides are so diverse. It operates in oil and gas but also the booming clean energy industry. There's also the minerals & metals and environment & infrastructure divisions. The group provides consulting, engineering and construction/project management primarily as designer-developer of strategic assets (also maintenance and decomissioning, in 2010 $2.45b of its $5.0b sales originated from the engineering design process). In the North Sea, it fabricates and designs oil rig platforms. It also services oil wells in Kuwait and aids oil safety efforts in the Gulf of Mexico where it designs and delivers components for the Marine Well Containment Company (MWCC). In Chile AMEC has a contract with Compañía Minera del Pacífico (EPCM) for work at the Cerro Negro Norte iron ore project.
After the nuclear meltdown in Japan, nuclear safety is also becoming a major issue. That's good for Amec because the company is experienced at nuclear cleanup and decommissioning problematic reactors. Amec's customers are diverse meaning the company appeals to a broad group of clients. Key clients include the US Navy, nuclear company URENCO, and oil and gas companies British Petroleum and ConocoPhillips.
In 2011 earnings per share (EPS) up +13% to 70.5 pence, grew faster than revenue/turnover (+11%). Amec also pays dividends ! 30.5 pence/share in 2011 which is +15% vs 2010 (26.5 pence). While we're talking about dividends keep this in mind, AMEC's dividends have gone up for four consecutive years. Dividends were 13.4p in 2007, 15.4p in 2008, 17.7p in 2009 and 26.5p in 2010. The company's operating cash flow was up +22% in 2011 to £267 million. Total pretax profit is up nearly 50% in just two years even though during that time revenue increased by only 28.4%.
In my opinion AMEC's products and services are invaluable to the energy industry. Though about 80% of revenue comes from Europe and North America, AMEC has offices in 40 countries worldwide. The company is also not afraid of making big acquisitions; Amec has a major growth strategy which is refers to as Vision 2015. It aims to make the company more multinational through acquisitions while also enhancing its capabilities in key sectors. Consistent with that goal, in 2011 Amec acquired Australian oil and gas consultancy group Zektingroup for AUS$48 million (gives it a presence on the East Coast of Australia, Zekting's workforce = 200) followed by Georgia-based Mactec on May 17, 2011 for US$280 million all in cash. The deal for Mactec was ingenious, although Mactec is already involved in the same kind of business its client base was a lot different (was more commercial and industrial). In its last year of being independent Mactec made $411M in revenue (compared to $5.0B for Amec in 2010).
Mactec
The Mactec deal added 2,600 employees to Amec and boosted its North American workforce up to about 14,000 (half of company total, NA operations account for roughly half of Amec's revenue). Mactec then became part of AMEC's Earth & Environmental division (environmental, water resources, infrastructure unit). Mactec gives Amec more business in the Western USA and Canada.
Other Strong Investments in the engineering industry (nyse: MTZ)
MasTec, Inc ! If you live in North America you probably make use MasTec built infrastructure on a regular basis. The company installs and maintains energy infrastructure most notaby that which is used in electrical utility transmission. For the first three months of 2012 calendar year MacTec revenue is up +25.87% quarter on quarter to $778.48 million. However, the bottom line didn't improve (in the quarter net income down -33% to $14M) because the cost of revenue was up +29.5% ($583.91m --> $684.66m). That may be an aberration owing to wildly fluctuating metal prices and other imput costs; The cost of revenue in the March 2012 quarter was at its lowest level in three quarters.

After the nuclear meltdown in Japan, nuclear safety is also becoming a major issue. That's good for Amec because the company is experienced at nuclear cleanup and decommissioning problematic reactors. Amec's customers are diverse meaning the company appeals to a broad group of clients. Key clients include the US Navy, nuclear company URENCO, and oil and gas companies British Petroleum and ConocoPhillips.
Important points to considerKey Financial Metrics to consider
- Amec added 3500 new employees in 2011 bringing the total to just over 27,000.
- Amec runs AMEC academy which helps new employees develop skills.
- Amec added a number of new customers in 2011 among them GDF Suez (Cygnus gas field) and nuclear power company Urenco.
- World primary energy demand is forecast to increase by 40% between 2009 and 2035 (12.15M tones of oil equivalent --> 16.950Mtoe).
- According to the world's biggest company ExxonMobil (2012 Global 2000 list released in April) global population will increase by 25% between 2010 and 2040 with non-OECD nations contributing 90% of energy demand growth.
- The Clean Energy market which is integral to Amec's business mix, was the recipient of $260 billion in global investment in 2011 which is a record high for that market.
In 2011 earnings per share (EPS) up +13% to 70.5 pence, grew faster than revenue/turnover (+11%). Amec also pays dividends ! 30.5 pence/share in 2011 which is +15% vs 2010 (26.5 pence). While we're talking about dividends keep this in mind, AMEC's dividends have gone up for four consecutive years. Dividends were 13.4p in 2007, 15.4p in 2008, 17.7p in 2009 and 26.5p in 2010. The company's operating cash flow was up +22% in 2011 to £267 million. Total pretax profit is up nearly 50% in just two years even though during that time revenue increased by only 28.4%.
In my opinion AMEC's products and services are invaluable to the energy industry. Though about 80% of revenue comes from Europe and North America, AMEC has offices in 40 countries worldwide. The company is also not afraid of making big acquisitions; Amec has a major growth strategy which is refers to as Vision 2015. It aims to make the company more multinational through acquisitions while also enhancing its capabilities in key sectors. Consistent with that goal, in 2011 Amec acquired Australian oil and gas consultancy group Zektingroup for AUS$48 million (gives it a presence on the East Coast of Australia, Zekting's workforce = 200) followed by Georgia-based Mactec on May 17, 2011 for US$280 million all in cash. The deal for Mactec was ingenious, although Mactec is already involved in the same kind of business its client base was a lot different (was more commercial and industrial). In its last year of being independent Mactec made $411M in revenue (compared to $5.0B for Amec in 2010).
Mactec
The Mactec deal added 2,600 employees to Amec and boosted its North American workforce up to about 14,000 (half of company total, NA operations account for roughly half of Amec's revenue). Mactec then became part of AMEC's Earth & Environmental division (environmental, water resources, infrastructure unit). Mactec gives Amec more business in the Western USA and Canada.
Other Strong Investments in the engineering industry (nyse: MTZ)
MasTec, Inc ! If you live in North America you probably make use MasTec built infrastructure on a regular basis. The company installs and maintains energy infrastructure most notaby that which is used in electrical utility transmission. For the first three months of 2012 calendar year MacTec revenue is up +25.87% quarter on quarter to $778.48 million. However, the bottom line didn't improve (in the quarter net income down -33% to $14M) because the cost of revenue was up +29.5% ($583.91m --> $684.66m). That may be an aberration owing to wildly fluctuating metal prices and other imput costs; The cost of revenue in the March 2012 quarter was at its lowest level in three quarters.
Tuesday, April 24, 2012
Coal: US, China take different position on coal, Israeli technology making waves in China
Thanks to increasingly hostile coal related US environmental regulation and an oversupply of coal in Asia as well as low natural gas prices, coal prices are near rock bottom. These factors have worked together to not only affect the price of coal but also demand from one of its main customers, utility plants; Traditionally over 45%, coal's share of power generation was at 39% in November 2011, the lowest level since March 1978. What's worrisome about that drop is this, the other main sources of popwer generation were all up (natural gas 22%-->26%, nuclear 20%-->22%, hydro 6%-->7%). What this also suggests is that the growth in renewables ARE NOT making any meaningful contribution to overall production (unsurprising given that their associated total costs of production exceed 20c per kWh, that compares to under 4c/kWh for coal) - not much incentive to shift over if you ask me.
Some are suggesting that it's the low price of natural gas that's causing companies to abandon coal but I say not so fast ! Even with the 49% drop in price (gas) between January and April 2012, per kWh gas there's still not much difference in cost when choosing it over coal. In Canada analysts expect natural gas prices to more than double over the next 1-2 years which would certainly take away any price incentive fueling the shift from coal to gas. (from $2.1/mmBTU April 22 --> $4.5 by 2014); Also keep in mind that while analysts almost unanimously agree that the price of natural gas will rise, the same can't be said of coal.
Natural gas averaged $4.00/mmBTU in 2011 but ended the year at only $2.75, it then fell further down to $1.40/mmBTU by April 19, 2012. Also to consider: The outlook for coal prices is not as good as it is for natural gas.

Though US coal exports were up +31.3% in 2011 to 107,258,561 tons total US coal production was up only +0.9% to 1,094,336,000 tons. Major contributors to that change were Latvia (142-->163 thousand tons), Japan (3164,098-->6911,539 tons) South Korea (5722,599-->10448,751 tons), India (2722,677-->4500,105 tons), Netherlands (7306,376-->10785,421 tons). Demand from Canada was down -40.0% to 6845,316 tons (in 2010 Canada lone demanded more than all of South America but because of changes in 2011, Brazil now demands about 1.8Mt more than Canada.
Israel and China
Although many renewable sources of energy require technology that's very expensive to build and with less desirable results, a new form of clean energy with relatively low operating costs (1c/kWh) is one that harnesses energy from naturally occurring sea waves. The production costs being only a quarter as much as it is for wind or solar, have attracted Chinese investors keen on bringing it to China. In 2010 the first of a number of Chinese sea wave plants was constructed in Guangzhou by Israeli company SDE. Though it has a capacity of only 1MW it ushers in the first of many such plants (Guangzhou alone will be home to 10000 MW capacity by the time the project is completed).
Facts
-Rock bottom shipping prices (freight) is making it easier for US coal producers to access Asian markets; In 2012 US coal exports to China are expected to double to 12M tonnes.
-Today, freight from the US Gulf of Mexico to China is around $50/tonnes, that compares to the bid price for coal of $102-104.
Friday, March 30, 2012
PetroChina (PTR), Sinopec (600688-SH) Chinese Energy Companies Stand Out; RIM Maintaining Shareholder Value; Canada Records Budget Surplus In January

For the month of January 2012 Canada recorded a monthly surplus ($1.7 billion), the first since February 2009. Canada's fiscal year ends in March; Thus far (March 2011 to January 2012) the federal deficit is $16 billion down from $27.7 billion in the previous period. Canada's annual deficits aren't expected to end until 2015 at the earliest (when it may be +$3.4 billion). For the 2010 ten month period ending Jan 2012, the reduction in deficit is attributable to higher revenues ($189b --> $197b) being met with lower program spending (-1.7%; $194.1b --> $190.8b). Canada's public debt spending is up +$300 million.
China sets sights on Mongolia
China already does a lot of business in Mongolia with state-owned Batou Steel Rre-Earth operating Inner Mongolia's large Bayan Obo mine. Now, coal company Shenhua Energy (China's biggest coal producer) is aiming to secure a 40% interest in the world's largest deposit of steelmaking coking coal, Tavan Tolgoi (home to six billion tonnes of coal), by mid 2012 just after Mongolia's next general election. Mongolia hasn't been an easy place for companies to do business; Last July, Mongolia promised Shenhua 40% of the project but that deal was revoked after other countries deemed the process unfair. Other bidders come from the US (Peabody Energy) and Russia (Russian Railways). The other major coal deposit in the south Gobi region Ovuut Tolgoi, was recently invested in by Chinese coal company Chalco (subsidiary of Chinalco); Chalco boughtout Ivanhoe Mine's 57% stake for $889 million. The largest resource in the South Gobi region is copper mine Oyu Tolgoi. At its peak Oyu Tolgoi will be the source of one third of Mongolia's gross domestic product. China is the world's leading consumer of coal.
China's largest oil company by production, Petro China (86% state-owned) produced more oil in 2011 than ExxonMobil after Exxon posted a reduction in total volumes. Exxon production -5% to 2.3M bpd while Petro China production +3.3% to 2.4M bpd. Petro China is a growing company that's for sure, but does that make it a great investment stock? I'm not so sure about that. Petro China was created with one objective: To feed China's increasing energy appetite. China's demand for petroleum products will grow by 100% over the next 25 years. The company is probably not overly concerned with shareholder value but who can blame them? China needs to secure oil in order to support the 8 and 9% gdp growth rates and state-owned enterprises like PetroChina and Sinopec are getting the job done.
Sinopec petro output was up +1.6% to 407.9M boe in 2011 (1.1M bpd) HOWEVER the increase came only from natural gas (73.6M boe --> 89.2M boe), crude oil production was down -1.9% to 321.7M boe). The higher output didn't add to profits; Fourth quarter earnings at Sinopec were down -23% attributed to a number of factors including higher tariffs in China (+7.1%) and the lower price of natural gas. In the first quarter of 2010 PetroChina bought a 9% interest in Canadian oil company Syncrude. In January 2012 a major Athabasca oil sands project came under complete control of PetroChina after the company paid $673 million for the 40% of shares that it didn't already own.
Warren Buffet was a PetroChina shareholder until September 2007. A lot of PetroChina's oil comes from Daquing and Changquing.
Sinopec, China's number two oil and gas company is China's largest oil refiner providing the country with 80% of its fuel. Due to increasing profits, in 2010 the company made Fortune 500 top ten list which is a feat considering the prices it receives for its produces is less than it would have in the free market due to governmental restrictions on pricing.
Research In Motion
The device marker is currently undergoing changes as evidenced by the resignation of key board members and an explicit desire to refocus business away from the consumer market. I'd interpret the company's recent statements this way: In countries such as the United States and South Korea where BlackBerry overall market share is low, the company will not have app using-typical users as the primary target for marketing however, in other countries such as the Canada, Argentina, South Africa and Indonesia (and maybe even the UK) RIM's existing consumer market will continue to be supported in a positive way (this is assumed given that the company stated it will cede only selected markets) - This is a wise decision for Research In Motion considering asset writedowns associated with the company's market value, reduced net income by more than $300 million in the latest quarter (ended March 2012).
I'm not really disappointed by RIM's latest results. PlayBook sales are up to 500,000 units from 200,000 units in the previous quarter. In the same quarter, adjusted net income was just over $400 million which is comparable to the previous quarter when revenue was significantly higher. PlayBook now holds 15% of the Canadian tablet market, up from 5% in late 2011. RIMM's stock was up +7.06% the day following the news (Friday March 30, 2012). Also note that 90% of Fortune 500 companies use the BlackBerry phone.
Monday, March 19, 2012
HSBC and JP Morgan record strong results in 2011 but stock market valuation still waning
Interesting Facts
- The China-Brazil trade corridoor had a compound annual growth rate of 30% during the last decade.
- China accounts for 18% of Brazil's total trade, up from 4% in 2000.
- HSBC has only been in Brazil since 1997 but it is already a significant contributor to the country's economy. HSBC now finances 6% of the Latin American country's foreign trade.
- Using current dollars, median household income in British Columbia, Canada is $68,000 today, down from $72,000 in 1971. (source: CBC) What's alarming about that is the fact that the average home price was only $272,000 which is a lot lower than today's $806,000.
- On November 29, 2011 JP Morgan sold 198.143 million shares of HSBC Holdings stock (1.11% interest in the company) for HK$58.83 a share. That reduced JP Morgan's interest in HSBC to 6.35% down from 7.46%
 JP Morgan
In 2011, the bank ranked first in terms of global investment banking fees. Though profit was down -22.9% over the last quarter of 2011, total annual profit for the year reached a record high of $19 billion +9.2% vs 2010; Net income per share improved even more, +13.1% to $4.48. During the fourth quarter, non-performing assets fell -33%. Also in the fourth, the bank repurchased $950 million worth of common stock, bringing the total repurchased on the year to $2.9 billion. It's important to remember that, even though JP Morgan has the highest market cap among the top banks (outside China) it remains smaller than Bank of America in terms of employees (260,000 vs 300,000) and revenue ($97.234b vs $115.0b).
What tells me the bank's business is a lot healthier today than last year is the charge-off's vs credit loans; Credit sales volume +10% on the year while consequently net-charge off's happened at the lower rate of 3.93% (down from 4.34%). Deposits are now at $1.1 trillion, +21%. JPMorgan's Investment Bank's provision for credit card losses was up to $272 million at the end of last quarter which compares nicely to the loss of $271 million last year and +54 million in the previous quarter (3Q2011). However it must be noted that, the increased provisions for credit card losses on the year caused net income for the investment bank division to fall by 52% to $726 million.
The commercial banking unit experienced a 21% increase in profit (to $643 million) on record net revenue. Net charge offs down from $286 million to $99 million.

HSBC
Market capitalization down significantly to $136 billion from $180 billion (end 2010) and $199 billion (end 2009). In fact, by the end of the the 2011 calendar year, Wells Fargo pulled ahead of HSBC in terms of market cap (Wells Fargo finished 26 overall, in front of HSBC at 28). Since the financial crisis of 2006-2007, over the last four years HSBC paid out more dividends than any other FTSE100 listed bank except one (US$27.2 billion/ $7.3b in 2011 alone). Dividends were up +14% in 2011. HSBC's costs +10% in 2011 due to, among other things, wage inflation (a new bank fee charged to it by the UK government in the amount of $570m. Underlying costs now account for 61% of revenue up from 55% in 2010). North American operations accounted for only 0.5% ($100m) of HSBC's profit before tax (compared to 2.4% = $454m in 2010).
North American business has become a bit more risky as it now accounts for 22.8% of the company's risk-weighted assets ($337.3m, up from $330.7m in 2010) even though the region represents only 19.7% of total assets ($504m out of $2555.6m). Many of the bank's key financial metrics were up on the year, however there were a couple that weren't; Down were: Underlying profit before taxation: -6% to $17.696 billion, total loans and advancements -2% to $940 million. Good decreases: Ratio of loan impairment chargest to total operating income down to 13.8% from 16.9% in 2010 and 31.7% in 2009.
- The China-Brazil trade corridoor had a compound annual growth rate of 30% during the last decade.
- China accounts for 18% of Brazil's total trade, up from 4% in 2000.
- HSBC has only been in Brazil since 1997 but it is already a significant contributor to the country's economy. HSBC now finances 6% of the Latin American country's foreign trade.
- Using current dollars, median household income in British Columbia, Canada is $68,000 today, down from $72,000 in 1971. (source: CBC) What's alarming about that is the fact that the average home price was only $272,000 which is a lot lower than today's $806,000.
- On November 29, 2011 JP Morgan sold 198.143 million shares of HSBC Holdings stock (1.11% interest in the company) for HK$58.83 a share. That reduced JP Morgan's interest in HSBC to 6.35% down from 7.46%
 JP Morgan
 In 2011, the bank ranked first in terms of global investment banking fees. Though profit was down -22.9% over the last quarter of 2011, total annual profit for the year reached a record high of $19 billion +9.2% vs 2010; Net income per share improved even more, +13.1% to $4.48. During the fourth quarter, non-performing assets fell -33%. Also in the fourth, the bank repurchased $950 million worth of common stock, bringing the total repurchased on the year to $2.9 billion. It's important to remember that, even though JP Morgan has the highest market cap among the top banks (outside China) it remains smaller than Bank of America in terms of employees (260,000 vs 300,000) and revenue ($97.234b vs $115.0b).
What tells me the bank's business is a lot healthier today than last year is the charge-off's vs credit loans; Credit sales volume +10% on the year while consequently net-charge off's happened at the lower rate of 3.93% (down from 4.34%). Deposits are now at $1.1 trillion, +21%. JPMorgan's Investment Bank's provision for credit card losses was up to $272 million at the end of last quarter which compares nicely to the loss of $271 million last year and +54 million in the previous quarter (3Q2011). However it must be noted that, the increased provisions for credit card losses on the year caused net income for the investment bank division to fall by 52% to $726 million.
The commercial banking unit experienced a 21% increase in profit (to $643 million) on record net revenue. Net charge offs down from $286 million to $99 million.
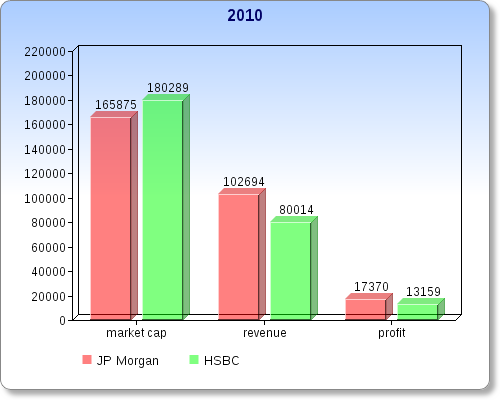
HSBC
Market capitalization down significantly to $136 billion from $180 billion (end 2010) and $199 billion (end 2009). In fact, by the end of the the 2011 calendar year, Wells Fargo pulled ahead of HSBC in terms of market cap (Wells Fargo finished 26 overall, in front of HSBC at 28). Since the financial crisis of 2006-2007, over the last four years HSBC paid out more dividends than any other FTSE100 listed bank except one (US$27.2 billion/ $7.3b in 2011 alone). Dividends were up +14% in 2011. HSBC's costs +10% in 2011 due to, among other things, wage inflation (a new bank fee charged to it by the UK government in the amount of $570m. Underlying costs now account for 61% of revenue up from 55% in 2010). North American operations accounted for only 0.5% ($100m) of HSBC's profit before tax (compared to 2.4% = $454m in 2010).
North American business has become a bit more risky as it now accounts for 22.8% of the company's risk-weighted assets ($337.3m, up from $330.7m in 2010) even though the region represents only 19.7% of total assets ($504m out of $2555.6m). Many of the bank's key financial metrics were up on the year, however there were a couple that weren't; Down were: Underlying profit before taxation: -6% to $17.696 billion, total loans and advancements -2% to $940 million. Good decreases: Ratio of loan impairment chargest to total operating income down to 13.8% from 16.9% in 2010 and 31.7% in 2009.
Monday, March 5, 2012
Gold Update Seabridge Gold SA, Kinross Gold KGC, World Gold Production Up & Oil; 2012 Will Be A Volatile Year For Stocks Hecla Mining HL, Airline Stocks
If the first two months are any indication, 2012 will be a very busy year for investors. Just when you think you're ahead of the game some external, unaccounted-for factor changes everything. It can be reassuring though, knowing that everyone has to adjust their portfolios accordingly. Take for example the airline industry;
 Over the last month (Feb - Mar) the price of WTI oil shot up 11% from just under $99/bbl to $109/bbl. Consequently, brent crude hit a 43-month high of $128.40/bbl on March 1, 2012. How did that affect airline stocks? They were BATTERED more than the fish at Red Lobster! Over the last month United Continental Holdings Inc (nyse:UAL) was -16%, Delta Air Lines (DAL) -14%, Lufthansa (DLAKY) -7%, negatives across the board all because of the price of oil. What's more, oil could soar even higher if Iran chooses to close the Strait of Hormuz because the Strait is used to transport 7% of the world's oil; Closure of the Strait of Hormuz is entirely possible now given that Europe has implemented an embargo on Iranian oil (supplied 4% of Europe's demand last year) and that it's already dealing with the toughest sanctions the West can impose on it (Iran is now demanding payment for its oil in gold). sidenote: India is one of a few countries that still imports oil from Iran.
Canadian bank stocks proving their value once again ! The two largest by size, Royal Bank of Canada (RBC) and Toronto-Dominion Bank (TD) raised dividends despite profits being lower. At RBC the dividend increase was 5.6% bringing it up to 0.57/share in the latest quarter (eps was down 4.7% to $1.21/share). At TD, the 1Q2012 showed mixed results. Though TD earnings dropped marginally (-0.01/share to $1.55) revenue grew 3.3% to $5.64B. Though profits did not grow the bank continued to hand out larger dividends (+4c quarterly to 0.72).
 Also making news is SNC-Lavalin. Partnered with Aecon, SNC won a $600M contract to refurbish Ontario, Canada's Darlington nuclear station. That pushed the stock up 2.2% in just the last day helping it to climb over the $6B level of capitalization. Prior to the news, the stock was reeling (lost $1.6B about 1/5th of its market cap in just the last couple days) because of reports of undocumented payments unrelated to company projects eroding away at 2011 profits.
The World is Producing More Gold but also Consuming More (led by China, Germany and Thailand)
In 2011, 11 of the world's 14 leading gold producing regions raised their output according to the US Geological Survey's 2012 Mineral Commodity Summaries, which isn't surprising considering the 28% jump in gold price (and cash costs, accordingly). On the year, world primary production was up 5.5% to 2700 tons (86.4M ounces). The world's 14 major producers accounted for 76.7% of output down from 78.2% in 2010. Although production in China was higher, the growth was not as great as it had been over the last couple years (+2.9% compared to +22.0% for #8 Ghana, +20.9% for #7 Canada and +16.4% for #11 Mexico). South Africa is home to 11.8% of the world's gold reserves (2nd overall behind Australia) but was the source of only 7% of production in 2011 bringing its overall rank down to 5 from 1 in 2007. Why the drop for South Africa? Because of ridiculously high production costs; South Africa has the unfavorable distinction of being the most expensive country to produce in (among major producing regions).
When investing in gold mining companies be sure to have companies with projects in Australia high on you list (ie BHP Billiton - Olympic Dam). Australia was the source of only 10% of global production last year but is home to 15% of reserves meaning growth will happen. Production costs (South Africa) and barriers to entry (China) are also not as problematic in Australia. In late 2011 China began drafting new standards for the gold industry which could have a significant effect on both investment and production in the country.
 Most of China's gold output comes from small companies but the new standards will eliminate some of them while at the same time, making it more difficult for new companies to enter the industry.
With regards to the United States, the gold supply and demand situation there is not as dire as one would expect. In 2011 GOLD CONSUMPTION ACTUALLY FELL -17% to 194.9 tonnes (2nd consecutive year that US gold demand dropped). That's in stark contrast to China (+22% to 811.2 tonnes) and Germany (+26% to 159.3 tonnes). Global consumption of gold in 2011 was 4067.1 tonnes, highest since 1997. Interestingly in Thailand (#7 consumer) where total consumption grew +57% to 108.9 tonnes, jewelry only accounted for 3.8% of the total (fell 34% on the year) but bar and coin demand +66% to 104.8 tonnes. The top six consumers remained the same,
Investing in gold: Mining Companies
Did you know? Mining companies are actually LOSING CAPITAL TO ETF'S ! According to Bank of Montreal analyst Peter Miller ETF's are a "hoover of capital and competition for the gold companies". To regain investor confidence (and capital) many producers are hiking up dividends. I think that mining stocks present a unique opportunity for investors at the moment. Yamana is raising quarterly dividends by 10%.
 With regards to gold producers, 2011 wasn't as profitable as one would expect. At Newmont Mining and Goldcorp, 2 of the 4 largest by market cap, net earnings were lower despite record breaking revenue. Part of the reason has to do with rising cash costs; +12.5% to $460 at Barrick Gold, +20.5% to $591/oz at Goldcorp (though lower from $270 to $223 when by products are taken into account), +40% at Australia's Newcrest, since 2009 +29.7% at Yamana Gold. Higher mining costs are atributable to increasing equipment, labor and raw material costs. Higher gold and silver prices buffered the effects of higher costs however companies need to do more to translate sales growth into earnings growth. The higher gold price allowed even AngloGold Ashanti to add to reserves; Anglogold's reserves went up 4.4M ounces bringing the total to 75.6M ounces; 3.7M of the 4.4M oz added came due to higher prices making extraction from ore at Vaal River economically viable (3.2M oz) and 0.5M oz attributable to improved ore reserve price at Geita.
South America increasingly important to major gold miners - Gold Fields will get 20% of its 2015 gold production from that region, up from 10% in 2011, 2% in 2008. In 2011 Gold Fields produced 3.697m ounces of gold which is 4.0% less than in 2010 (3.851m ounces) but it did receive 28.6% more for each ounce of gold ($1569 vs $1220). Barrick Gold's huge project Pascua Lama is in Argentina. Goldcorp's largest venture is the Penasquito mine in Mexico.
Undervalued Mining Companies
Seabridge Gold (tsx: SEA) - In February released its 2012 Operations Overview and the new data is impressive to say the least (maybe that's why the stock is UP +8% since February 13, still down though over 20% last 6 months because of increased volatility in metal prices (even Barrick Gold is down 10% over six months). Its flagship project, KSM has 2P reserves of 38.5M ounces for gold, 9.985B pounds for copper, 214M ounces of silver and 257M pounds of molybdenum; That means it has more gold than world renown projects Pueblo Viego, Penasquito and possibly even Ivanhoe Mine's mega project Oyu Tolgoi (46.4M ounces of gold) if KSM reserves are increased in April which is likely given the successful M&I drilling results reported by the company on February 8, 2012. Reserves in situ value is about 15% greater than Goldcorp's Penasquito and Seabridge's enterprise value per ounce of reserves is only $21 ! which is ridiculously low considering it's $1200 at Canada's other major gold junior-mid cap company AuRico. At Detour Gold and Osisko Mining enterprise value/oz is around $400. Don't forget that KSM isn't the only major Seabridge project, there's also Courageous Lake (8M oz M&I 16 year mine life). Because reserve grade is relatively low the company will benefit from rising metal prices moreso than say Yamana Gold.
 This company screams undervalued. How does a company with 40M ounces of 2P gold reserves (more than Yamana Gold, Agnico-Eagle Mines) at just one of its projects have a market cap under $1 billion ? Royal Gold has shown confidence in the company's numbers (invested $100m in Seabridge last year). The construction costs remain quite high but I think that $2000 gold (when it happens) will open up more financing options (like Eldorado Gold recently got from Qatar Holdings). Consider this: 2 years ago when gold prices were a lot lower, Barrick Gold paid Kinross Gold $475m ($455m cash) for 25% interest in the Cerro Casale gold copper project which has only 60% as much gold as KSM. That would value KSM at over 3X Seabridge Gold's market cap at present.
Hecla Mining Company (nyse: HL) - On January 11, 2012 Hecla announced that the Lucky Friday Mine in Idaho which produced 31.5% of the company's 9,498,337 ounces of silver in 2011, will be shut down for the entire 2012 year. The day of the announcement the stock fell 18.7% from $5.67 --> $4.61. All this because of a December 2011 accident at Lucky Friday in which a number of employees were injured when the mine collapsed (including a couple fatalities). You can be sure that whatever structural problems caused the collapse will be dealt with quickly (only two months was needed to fix the problem, the 12 month closure is due to new inspections and safety procedures required by federal regulators; A group of shareholders even tried to sue the government over the closure). Hecla wasn't the only miner that suffered fatalaties last quarter, 6 people died in accidents at three AngloGold Ashanti mines.
Though Lucky Friday is the source of only 31% of silver output (0% for gold) and 30% of 2P silver reserves, it's Hecla's only source of proven silver reserves (~21 million ounces); In 2011 it was the source of all of Hecla's total increase in 2P silver reserves (+7 million ounces), so it remains a significant growth project for the company. Lucky Friday also makes the company more diversified, being home to three-quarters of its 1.5 million ton lead resource. The other operating mine, Green's Creek was purchased from Rio Tinto in 2008.
There are many reasons to like Hecla Mining
Barrick Gold - Pueblo Viejo (60%) and Pascua Lama mines will begin producing in 2012/2013. When fully operational (2016) the mines will add 1.5 million ounces of annual output to Barrick Gold's current production of 7.68 million ounces. Pueblo Viejo is 90% complete. Barrick profited 25% more in 2011 than it did last year ($4.48 billion, $$4.67 billion adjusted). In February Barrick exited Russia when it sold off its last remaining asset there (25% interest in Highland Gold).
Goldcorp - 2011 production was 2.5147 million ounces. By 2016 production will rise to 4.2 million ounces. Revenue grew by 43% in 2011 more than any other top 10 gold miner. El Morro in Chile ($3.9b project) is one of the reasons for the higher output projection.
Newcrest Mining - 515,000 oz of gold in 2011 came from the Telfer mine representing about 20% of company total (Telfer is home to 14.9% of its 79.1M oz of reserves, 7.7% of the 8.36M tonnes of copper reserves). Total company production in the 2Q2012 FY (ending December 2011) was 579,023 oz down 19.9% qoq, the quarter before that 1Q2012 output was down 16% to 587,296 oz. Over the last two quarters production from Telfer was down 50,000 oz. 2011 calendar year production increase comes entirely from the Lihir Gold acquisition.
Kinross Gold - Yes it was hit with a $2.94 billion impairment charge stemming from an unexpected writedown on its Tasiast mine in Mauritania absorbed during the fourth quarter of 2011. That effectively more than wiped out any profit the company was on track to make in 2011 (ended up losing just over $2B on the year). But keep in mind the company's revenue (+31%), gold production (+13.0% to 2.6M oz), and cost of sales (+28% even though production up more than 30%, production cost of sales up 17.7% to $596/oz which is comparable to its peers in the industry). Another telling statistic: cash margins up 32% to $906/oz ($965 in 4Q +23%), margins were also up 32% at America's largest gold miner Newmont Mining (Newmont's stock is up 16% last 12 months, Kinross is down -32% even though Newmont also suffered from a bad fourth quarter; -$1B losses at Newmont in 4Q2011 brining total profit for the year down to $366m). Also to consider; Agnico-Eagle Mines took on a $644.9m writedown on its Meadowbank mine in the 4Q giving the company a net loss of $601.4m in the 4Q. The mine plan had to be changed because of its 'high cost nature'.
Also, annual dividend was up 10% to record high 11 cents a share (though none was paid in the problematic 4th quarter). The company was valued at $19B as recently as May 2011 which is almost 60% more than it is today. That brings its market value per ounce of reserve to a near industry low $130/oz (compare that to Goldcorp's $618/oz at, $708/oz at Yamana Gold). Cash flow from operating activities +40.3% to $1.8093b on the year, convinced yet? Then consider the possible takeover offers. European Goldfields which isn't even producing yet and has only a fraction as much gold as Kinross, recently got $2.5B from Eldorado Gold. Kinross has low cash costs, lucrative projects (Cerro Casale) and a growing revenue stream and that makes it a lot more valuable in a M&A scenario. CAPEX was +163% to $1.6515.
Don't forget that Kinross's current market cap of about $12B is about the same as it was before it acquired $7B Red Back Mining.
Eldorado Gold (nyse: EGO) - Coming off a record year for gold production (+4% to 658,652 oz), revenue (+33% to $1.042b) and even profit (eps +41.5% to 58c) while dividends more than doubled from 5c a share to 11c. Operating cash flow was also strong, up 40%. AND unlike the other major gold producers total cash costs only went up marginally ($382 --> $405). The European Goldfields acquisition will make it the biggest gold producer in Europe by 2015 (1.5m ounces a year) which couldn't come at a better time; European demand for gold is stronger than ever as is the price of gold.
New Gold (tsx: NGD) - In June 2012 its fourth operating mine will open. That will push company production over 400,000 ounces for the first time. Goldcorp's El Morrow (New Gold's interest is 30%) will reach full production in 2018 which should give the company an additional 150,000 ounces annually.
Newmont Mining - Gold reserves grew 9% in 2011 to 99M ounces a third of which is in Nevada, 17% in Africa. Reserves were 93.5M one year earlier and 91.8M oz December 2009. Biggest source of attraction at Newmont right now are the dividends, 4Q2011 quarterly dividend up 133% to 0.35 a share.
Also of interest:
-On March 1, 2012 Newcrest Mining, Australia's largest pureplay gold company began trading on the Toronto Stock Exchange. It will be the 4th largest mining company with a listing in Toronto.
-USA has 3rd highest corporate tax rate in the world.

Canadian bank stocks proving their value once again ! The two largest by size, Royal Bank of Canada (RBC) and Toronto-Dominion Bank (TD) raised dividends despite profits being lower. At RBC the dividend increase was 5.6% bringing it up to 0.57/share in the latest quarter (eps was down 4.7% to $1.21/share). At TD, the 1Q2012 showed mixed results. Though TD earnings dropped marginally (-0.01/share to $1.55) revenue grew 3.3% to $5.64B. Though profits did not grow the bank continued to hand out larger dividends (+4c quarterly to 0.72).

The World is Producing More Gold but also Consuming More (led by China, Germany and Thailand)
In 2011, 11 of the world's 14 leading gold producing regions raised their output according to the US Geological Survey's 2012 Mineral Commodity Summaries, which isn't surprising considering the 28% jump in gold price (and cash costs, accordingly). On the year, world primary production was up 5.5% to 2700 tons (86.4M ounces). The world's 14 major producers accounted for 76.7% of output down from 78.2% in 2010. Although production in China was higher, the growth was not as great as it had been over the last couple years (+2.9% compared to +22.0% for #8 Ghana, +20.9% for #7 Canada and +16.4% for #11 Mexico). South Africa is home to 11.8% of the world's gold reserves (2nd overall behind Australia) but was the source of only 7% of production in 2011 bringing its overall rank down to 5 from 1 in 2007. Why the drop for South Africa? Because of ridiculously high production costs; South Africa has the unfavorable distinction of being the most expensive country to produce in (among major producing regions).
When investing in gold mining companies be sure to have companies with projects in Australia high on you list (ie BHP Billiton - Olympic Dam). Australia was the source of only 10% of global production last year but is home to 15% of reserves meaning growth will happen. Production costs (South Africa) and barriers to entry (China) are also not as problematic in Australia. In late 2011 China began drafting new standards for the gold industry which could have a significant effect on both investment and production in the country.

With regards to the United States, the gold supply and demand situation there is not as dire as one would expect. In 2011 GOLD CONSUMPTION ACTUALLY FELL -17% to 194.9 tonnes (2nd consecutive year that US gold demand dropped). That's in stark contrast to China (+22% to 811.2 tonnes) and Germany (+26% to 159.3 tonnes). Global consumption of gold in 2011 was 4067.1 tonnes, highest since 1997. Interestingly in Thailand (#7 consumer) where total consumption grew +57% to 108.9 tonnes, jewelry only accounted for 3.8% of the total (fell 34% on the year) but bar and coin demand +66% to 104.8 tonnes. The top six consumers remained the same,
Investing in gold: Mining Companies
Did you know? Mining companies are actually LOSING CAPITAL TO ETF'S ! According to Bank of Montreal analyst Peter Miller ETF's are a "hoover of capital and competition for the gold companies". To regain investor confidence (and capital) many producers are hiking up dividends. I think that mining stocks present a unique opportunity for investors at the moment. Yamana is raising quarterly dividends by 10%.

South America increasingly important to major gold miners - Gold Fields will get 20% of its 2015 gold production from that region, up from 10% in 2011, 2% in 2008. In 2011 Gold Fields produced 3.697m ounces of gold which is 4.0% less than in 2010 (3.851m ounces) but it did receive 28.6% more for each ounce of gold ($1569 vs $1220). Barrick Gold's huge project Pascua Lama is in Argentina. Goldcorp's largest venture is the Penasquito mine in Mexico.
Undervalued Mining Companies
Seabridge Gold (tsx: SEA) - In February released its 2012 Operations Overview and the new data is impressive to say the least (maybe that's why the stock is UP +8% since February 13, still down though over 20% last 6 months because of increased volatility in metal prices (even Barrick Gold is down 10% over six months). Its flagship project, KSM has 2P reserves of 38.5M ounces for gold, 9.985B pounds for copper, 214M ounces of silver and 257M pounds of molybdenum; That means it has more gold than world renown projects Pueblo Viego, Penasquito and possibly even Ivanhoe Mine's mega project Oyu Tolgoi (46.4M ounces of gold) if KSM reserves are increased in April which is likely given the successful M&I drilling results reported by the company on February 8, 2012. Reserves in situ value is about 15% greater than Goldcorp's Penasquito and Seabridge's enterprise value per ounce of reserves is only $21 ! which is ridiculously low considering it's $1200 at Canada's other major gold junior-mid cap company AuRico. At Detour Gold and Osisko Mining enterprise value/oz is around $400. Don't forget that KSM isn't the only major Seabridge project, there's also Courageous Lake (8M oz M&I 16 year mine life). Because reserve grade is relatively low the company will benefit from rising metal prices moreso than say Yamana Gold.
The same month, on February 8, 2012 measured and indicated resources at KSM improved by 3.7 million ounces for gold (to 49.0 million ounces) meaning that drill results continue to be successful. What it also means is that the company's next report on proven and probable reserves (April 2012) will likely indicate further increases in 2P reserves, past the current estimate. In the February report, Seabridge Gold estimates annual production at KSM will be 854,000 ounces (gold), 166 million pounds (copper), 2.9 million ounces (silver), 1.1 million pounds (molybdenum) for the first seven years (the mine has a 52 year mine life, molybdenum production will actually grow after the first seven years). Base cash cost will be $231/oz which is even lower than Goldcorp ($300).

Hecla Mining Company (nyse: HL) - On January 11, 2012 Hecla announced that the Lucky Friday Mine in Idaho which produced 31.5% of the company's 9,498,337 ounces of silver in 2011, will be shut down for the entire 2012 year. The day of the announcement the stock fell 18.7% from $5.67 --> $4.61. All this because of a December 2011 accident at Lucky Friday in which a number of employees were injured when the mine collapsed (including a couple fatalities). You can be sure that whatever structural problems caused the collapse will be dealt with quickly (only two months was needed to fix the problem, the 12 month closure is due to new inspections and safety procedures required by federal regulators; A group of shareholders even tried to sue the government over the closure). Hecla wasn't the only miner that suffered fatalaties last quarter, 6 people died in accidents at three AngloGold Ashanti mines.
Though Lucky Friday is the source of only 31% of silver output (0% for gold) and 30% of 2P silver reserves, it's Hecla's only source of proven silver reserves (~21 million ounces); In 2011 it was the source of all of Hecla's total increase in 2P silver reserves (+7 million ounces), so it remains a significant growth project for the company. Lucky Friday also makes the company more diversified, being home to three-quarters of its 1.5 million ton lead resource. The other operating mine, Green's Creek was purchased from Rio Tinto in 2008.
There are many reasons to like Hecla Mining
* The price of silver jumped 74.2% in 2011, single handedly causing Helca's profit to grow 286% to $150.6M. Revenue reached a record high of $477M even though it sold 13.3% less silver; in fact sales of all four metal types were down (-17.5% for gold, -16.6% for lead, -12.4% for zinc). The company's stock value is down -50% from a year ago even though revenue and profit is up significantly; Even considering the 30% drop in silver production, next year company profits probably won't be less than they were in 2010 with high commodity prices a mainstay.Thompson Creek Metals (tsx: TCM) - The stock has been in selloff mode for the better part of a week after the company reported that the Mt. Milligan project will cost more than previously thought. That prompted TD Bank to downgrade it.
* The company has no debt and nearly $290M in cash and cash equivalents.
* Lucky Friday structural damage only needs two months to fix.
* Hecla Mining has three other significant projects at San Sebastien, San Juan and Noonday. Company's valuation at present definitely isn't giving any of those projects respect.
Barrick Gold - Pueblo Viejo (60%) and Pascua Lama mines will begin producing in 2012/2013. When fully operational (2016) the mines will add 1.5 million ounces of annual output to Barrick Gold's current production of 7.68 million ounces. Pueblo Viejo is 90% complete. Barrick profited 25% more in 2011 than it did last year ($4.48 billion, $$4.67 billion adjusted). In February Barrick exited Russia when it sold off its last remaining asset there (25% interest in Highland Gold).
Goldcorp - 2011 production was 2.5147 million ounces. By 2016 production will rise to 4.2 million ounces. Revenue grew by 43% in 2011 more than any other top 10 gold miner. El Morro in Chile ($3.9b project) is one of the reasons for the higher output projection.
Newcrest Mining - 515,000 oz of gold in 2011 came from the Telfer mine representing about 20% of company total (Telfer is home to 14.9% of its 79.1M oz of reserves, 7.7% of the 8.36M tonnes of copper reserves). Total company production in the 2Q2012 FY (ending December 2011) was 579,023 oz down 19.9% qoq, the quarter before that 1Q2012 output was down 16% to 587,296 oz. Over the last two quarters production from Telfer was down 50,000 oz. 2011 calendar year production increase comes entirely from the Lihir Gold acquisition.
Kinross Gold - Yes it was hit with a $2.94 billion impairment charge stemming from an unexpected writedown on its Tasiast mine in Mauritania absorbed during the fourth quarter of 2011. That effectively more than wiped out any profit the company was on track to make in 2011 (ended up losing just over $2B on the year). But keep in mind the company's revenue (+31%), gold production (+13.0% to 2.6M oz), and cost of sales (+28% even though production up more than 30%, production cost of sales up 17.7% to $596/oz which is comparable to its peers in the industry). Another telling statistic: cash margins up 32% to $906/oz ($965 in 4Q +23%), margins were also up 32% at America's largest gold miner Newmont Mining (Newmont's stock is up 16% last 12 months, Kinross is down -32% even though Newmont also suffered from a bad fourth quarter; -$1B losses at Newmont in 4Q2011 brining total profit for the year down to $366m). Also to consider; Agnico-Eagle Mines took on a $644.9m writedown on its Meadowbank mine in the 4Q giving the company a net loss of $601.4m in the 4Q. The mine plan had to be changed because of its 'high cost nature'.
Also, annual dividend was up 10% to record high 11 cents a share (though none was paid in the problematic 4th quarter). The company was valued at $19B as recently as May 2011 which is almost 60% more than it is today. That brings its market value per ounce of reserve to a near industry low $130/oz (compare that to Goldcorp's $618/oz at, $708/oz at Yamana Gold). Cash flow from operating activities +40.3% to $1.8093b on the year, convinced yet? Then consider the possible takeover offers. European Goldfields which isn't even producing yet and has only a fraction as much gold as Kinross, recently got $2.5B from Eldorado Gold. Kinross has low cash costs, lucrative projects (Cerro Casale) and a growing revenue stream and that makes it a lot more valuable in a M&A scenario. CAPEX was +163% to $1.6515.
Don't forget that Kinross's current market cap of about $12B is about the same as it was before it acquired $7B Red Back Mining.
Eldorado Gold (nyse: EGO) - Coming off a record year for gold production (+4% to 658,652 oz), revenue (+33% to $1.042b) and even profit (eps +41.5% to 58c) while dividends more than doubled from 5c a share to 11c. Operating cash flow was also strong, up 40%. AND unlike the other major gold producers total cash costs only went up marginally ($382 --> $405). The European Goldfields acquisition will make it the biggest gold producer in Europe by 2015 (1.5m ounces a year) which couldn't come at a better time; European demand for gold is stronger than ever as is the price of gold.
New Gold (tsx: NGD) - In June 2012 its fourth operating mine will open. That will push company production over 400,000 ounces for the first time. Goldcorp's El Morrow (New Gold's interest is 30%) will reach full production in 2018 which should give the company an additional 150,000 ounces annually.
Newmont Mining - Gold reserves grew 9% in 2011 to 99M ounces a third of which is in Nevada, 17% in Africa. Reserves were 93.5M one year earlier and 91.8M oz December 2009. Biggest source of attraction at Newmont right now are the dividends, 4Q2011 quarterly dividend up 133% to 0.35 a share.
Also of interest:
-On March 1, 2012 Newcrest Mining, Australia's largest pureplay gold company began trading on the Toronto Stock Exchange. It will be the 4th largest mining company with a listing in Toronto.
-USA has 3rd highest corporate tax rate in the world.
Subscribe to:
Posts (Atom)