Showing posts with label jp morgan. Show all posts

Monday, September 3, 2012

20 Largest Banks & Financial Institutions in the World Globally as of September 3, 2012 (revenue, assets, deposits, hsbc, icbc, fiscal, capitalization)


Banks are ranked by most recent financial data, revenue, assets, earnings, market value.  TD Bank data is from the February to July 2012 period. % change in market value over the last year represents the change in total market value.  When USA, NYSE, or ADR is shown it means the stock value was already in USD. Just missed the list: Unicredito Italiano (Unicredit Group), Assicurazioni Generali (Generali Group), Royal Bank of Canada.
           
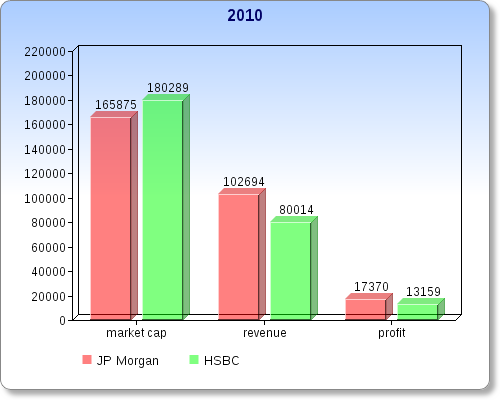
                        A lot has happened since my last report on the banks exactly one year ago.  In May 2012 JP Morgan's CEO announced that faulty derivatives trading caused the bank to lose more than $2 billion. The news sent the stock reeling, in after hours trading that day the company lost more than 11% of its market value. The loss is significant because that's about the same amount of market cap that separated it from the other top valued financial institutions.

Canadian banks are aggressively pursuing acquisitions ! Between 2008 and May 2012 Canadian banks spent $37.8 billion on ~100 acquisitions which is impressive considering big banks like Citibank and BNP Paribas were trying hard to sell off assets.  To put things into perspective, between 2001 and 2008 Canada's six big banks spent $38.0 billion on acquisitions meaning that today they are spending at roughly twice the rate they used to. One thing to consider though is the fact that a lot of their recent acquisitions bolster their position in Canada rather than overseas;  95% of the purchases they made between 2001 and 2008 were abroad.  So far in 2012 some of the biggest Canadian deals were made by TD Canada (acquisition of MBNA Canada) and more recently the Bank of Nova Scotia (August 31, 2012 closes deal with ING Groep for ING Canada, paying only $1.9 billion net in cash for 3% of the Canadian market for retail banking).  ING used the money to help pay off a government bailout it received a few years ago. That's pretty much it for ING in Canada, if you remember, back on May 13, 2009 ING sold all of its share in ING Insurance to institutional investors for $2.2 billion. Today, that 70% share is worth about $5.5 billion. Why is ING so eager to get out of Canada ?

In the summer of 2012, the Agricultural Bank of China lauched its Canadian operations in Vancouver.  Chinese institutions clearly want a piece of the Canadian market but is it too little too late ?  Canada's retail banking market is already highly congested meaning that Chinese banks will probably have to attempt a takeover or two if they really want to be a player.  Afterall, the first takeover of of a US bank by a Chinese one (ICBC) happened only four months ago on May 9, 2012.  ICBC paid $140 million for 80% of the Bank of East Asia (13 American branches).  ICBC (Industrial and Commercial Bank of China) reported in its 2Q2012 report a rise of 36.6% in the value of its overseas assets in only six months !  ICBC assets abroad are now worth US$ 166.6 billion.  Since the US Fed approved the deal, three Chinese banks are now permitted to operate in the United States.

In China, payment delays are becoming more problematic especially in the mining sector (debt owed to machinery companies up significantly). That's causing headaches for the big four banks there which have seen their market capitalization drop off quite a bit from last year's highs.  More of the loans on their books are becoming risker and investors are taking notice.

Royal Bank of Scotland: I excluded it from my list last year and again this year.  This year the bank's problems go beyond just the unending quarterly losses.  The company's market value remains pennies on the dollar at just over US$20 billion which is lower than it was at this time last year. The bank remains mired in problems which include conflicts of interest, rigging of inter-bank borrowing, IT malfunctions, problems in Ireland. The bank's market cap has been erratic as of late.  It's also 83% owned by the British government.

World's 21 leading financial institutions with data from last six months as quoted in company reports (using domestic currency):  click on link for company interim 2012 report (in the case of TD Bank it's the 2nd + 3rd qtr ending July 31, 2012)

Bank Assets Revenue Net Income
June 2012 June 2011 % chg 1H12 1H11 % chg 1H12 1H11 % chg
ICBC 16,431,196
(mar'12)
14,896,048 +10.3% 258,900 231,160 +12.0% 123,200 109,600 +12.4%
HSBC 2,652,334 2,690,987 -1.4% 43,672 42,311 +3.2% 9108 9762 -6.7%
ConstrBank 13,505,745 11,754,766 +14.9% 227,812 197,246 +15.5% 106,494 92,953 +14.6%
JP Morgan 2,290,146 2,246,764 +1.9% 48,232 52,000 -7.2% 9884 10,986 -10.0%
AgriBank 12,112,888 10,725,141 +12.9% 210,780 184,633 +14.2% 80,522 66,679 +20.8%
BO China 12,825,590 11,483,498 +11.7% 179,665 165,974 +8.2% 75,002 70.234 +6.8%
Citigroup 1,916,500 1,956,600 -2.0% 38,048 40,348 -5.7% 5877 6340 -7.3%
BO America 2,190,868 2,338,826 -6.3% 44,246 40,113 +10.3% 3116 -6777 up
TD Bank 806,283 713,642 +13.0% 11,591 10,540 +10.0% 3396 2894 +17.3%
Itau Unibanco 888,809 793,679 +12.0% 40,183 35,821 +12.2% 6729.8 7132.5 -5.6%
Santander 1,292,677 1,231,908 +4.9% 22,544 21,403 +5.3% 1704 3501 -51.3%
AIG 555,383 610,427 -9.0% 35,566 34,119 +4.2% 5788 3554 +62.9%
BNP 1,970,041 1,983,154 -0.7% 19,984 22,666 -11.8% 5082 5246 -3.1%
Goldman Sachs 948,638 936,910 +1.3% 16,575 19,175 -13.6% 3071 3822 -19.6%
UBS 1,412,043 1,419,162 -0.5% 12,934 15,515 -16.6% 1252 2822 -55.6%
Lloyds 961,371 978,951 -1.8% 8,965 10,868 -17.5% -641 2278 up
Barclays 1,631,265 1,492,922 +9.3% 15,475 15,299 +1.2% 480 1983 -75.8%
Deutsche 2,241,174 2,164,103 +3.6% 17,214 19,014 -9.5% 2063 3363 -38.7%
ING Groep 1,237,248 1,240,731 -0.3% 7,759 7,137 +8.7% 1851 2888 -35.9%
IntesaSan 666,417 644,673 +3.2% 8944 8720 +2.6% 1274 1402 -9.1%
SocGen 1,246,666 1,158,008 +7.7% 12,583 13,122 -4.1% 1405 1897 -25.9%


Highlights and Some Key Data To Keep In Mind:

Industrial and Commercial Bank of China
Revenue growth outpaced growth in operating expenses (13.7% vs 12.6% for the half) and that pushed the cost to income ratio down to 25.57% which is a first half record low.  EPS 0.35 RMB up from 0.31 RMB qoq.
On July 6, 2012 ICBC announced the closing of the acquision of 80% of the Bank of East Asia, a deal that gave it a foodhold in the US market.
By June 30, 2012 ICBC middle east operations already surpassed their 2011 full year earnings.
S&P has a slightly higher rating of the bank vs Moody's (outlook positive vs stable). 
June 2012:  ICBC is present in 34 countries, overseas asset value at US$ 166.6 billion +33.6% since December 2011.

Banco Santander
Profit from continuing operations was €3472m down only 11.9% from (€3940m).  The real profit decline of 51.3% --> €1704m is due to the setting aside of €1,304 million in the 2Q12 in provisions for property (real estate exposure in Spain);  That reduced 2Q12 net income from €1,404 million --> €100 million.

American International Group Inc. AIG
Insurance premiums contributed 53.6% of revenue ($19,080m / $35,566m) which is down from 56.8% in 1H2011 ($19,380m / $34,119m)

Deutsche Bank
In euros, assets (+3.56%) and deposits (+0.61%) went up in value but because the euro lost -8.19% of its value relative to the USD when denomited in dollars both experienced a decrease in value.

Societe Generale
Asset value actually went up +7.66% however the euro lost -8.19% of its value relative to the USD and that caused SocGen asset value to fall slightly when denominated in dollars.

Agricultural Bank of China Breakdown of Customer Deposits 
June 30, 2012:  53.4% are demand deposits (28.3% individuals / 25.1% corporate), 41.4% time deposits (39.8% individuals / 11.6% corporate), rest are other.
June 30, 2011:  57.4% demand deposits (28.6% individuals / 28.8% corporate), 38.9% time deposits (28.7% individuals / 10.2% corporate), the rest are other.
Revenue is quoted as operating income, customer deposits are referred to as Due to Customers.

China Construction Bank
EPS  basic and diluted are the same, 0.43 rmb up from 0.37 rmb
The bank's cost to income ratio down to 32.73 from 36.19 year ending December 31, 2011
Customer deposits breakdown:  June 30, 2012:  51.2% are demand deposits (18.3% personal / 32.9% corporate), 48.8% time deposits (27.9% personal / 20.9% corporate), rest are other.
June 30, 2011:  53.5% demand deposits (18.5 personal / 35.0% corporate), 45.2% time deposits (26.7% personal / 18.5% corporate), the rest are other.

Toronto-Dominion Bank
TD's 3Q2012 was one of the best on record;  EPS (basic) up to $1.92 from $1.84 in 2Q2012, $1.77 in 3Q2011.  Though the company's bottom line was much improved, it didn't result in any dividend hikes (still at 0.72 q2q, but up from 0.66 last year).
For the recent third quarter wealth and insurance net income was +3.15% --> $360 million (21.1% of total group profit).
In just the last 3 months TD's total assets are up +4.28% !
Revenue grew +1.6% between April 2012 (2q) and July 2012 (3q) compared to 5.2% between April 2011, July 2011.
Only 16% of its wealth and insurance net income comes from its ~ 30% stake in TD Ameritrade.
In 2012 TD acquired MBNA Canada.

About the table at the top of the article, currencies used*Average fx rate calculated myself using data at x-rates.com and google finance exchange.
Exchange rates used to convert to USD for the 6-month period (used for customer deposits, revenue, net income/profit)
Chinese RMB 1hfy12 0.158243255555, 1hfy11 0.1529334634 up 3.47%.
Euro 1hfy12 1.29745937777, 1hfy11 1.403703906 down 7.57%.
Swiss Franc 1hfy12 1.07705781666, 1hfy11 1.10659625 down 2.67%
Brazilian Real 1hfy12 1.86424560555, 1h11 1.6312765625 down 14.28%.
British Pound 1hfy12 1.57693847777, 1hfy11 1.61702795275 down 2.48%.
Canadian Dollar 1hfy12 1.00605145856, 1hfy11 0.9704058232 down 3.67%

Currencies used for assets last day of most recent reporting period
Chinese RMB   June 30: 2012  6.3550, 2011 6.46350
                           March 31, 2012 6.29700  (ICBC)
Euro  June 30: 2012   1.266350,  2011   1.451931
Swiss Franc  June 30: 2012  0.947650, 2011   0.84160
Brazilian Real  June 30: 2012   2.00950, 2011  1.560491
British Pound  June 30; 2012   0.636679, 2011   0.62250
Canadian Dollar  July 31: 2012   0.955100, 2011   0.955100

Monday, March 19, 2012

HSBC and JP Morgan record strong results in 2011 but stock market valuation still waning

Interesting Facts

- The China-Brazil trade corridoor had a compound annual growth rate of 30% during the last decade.
- China accounts for 18% of Brazil's total trade, up from 4% in 2000.
- HSBC has only been in Brazil since 1997 but it is already a significant contributor to the country's economy. HSBC now finances 6% of the Latin American country's foreign trade.
- Using current dollars, median household income in British Columbia, Canada is $68,000 today, down from $72,000 in 1971. (source: CBC) What's alarming about that is the fact that the average home price was only $272,000 which is a lot lower than today's $806,000.
- On November 29, 2011 JP Morgan sold 198.143 million shares of HSBC Holdings stock (1.11% interest in the company) for HK$58.83 a share.  That reduced JP Morgan's interest in HSBC to 6.35% down from 7.46%


JP Morgan

       In 2011, the bank ranked first in terms of global investment banking fees. Though profit was down -22.9% over the last quarter of 2011, total annual profit for the year reached a record high of $19 billion +9.2% vs 2010;  Net income per share improved even more, +13.1% to $4.48. During the fourth quarter, non-performing assets fell -33%.  Also in the fourth, the bank repurchased $950 million worth of common stock, bringing the total repurchased on the year to $2.9 billion.  It's important to remember that, even though JP Morgan has the highest market cap among the top banks (outside China) it remains smaller than Bank of America in terms of employees (260,000 vs 300,000) and revenue ($97.234b vs $115.0b).

What tells me the bank's business is a lot healthier today than last year is the charge-off's vs credit loans;  Credit sales volume +10% on the year while consequently net-charge off's happened at the lower rate of 3.93% (down from 4.34%).  Deposits are now at $1.1 trillion, +21%.  JPMorgan's Investment Bank's provision for credit card losses was up to $272 million at the end of last quarter which compares nicely to the loss of $271 million last year and +54 million in the previous quarter (3Q2011).  However it must be noted that, the increased provisions for credit card losses on the year caused net income for the investment bank division to fall by 52% to $726 million.

The commercial banking unit experienced a 21% increase in profit (to $643 million) on record net revenue. Net charge offs down from $286 million to $99 million.

HSBC

Market capitalization down significantly to $136 billion from $180 billion (end 2010) and $199 billion (end 2009).  In fact, by the end of the the 2011 calendar year, Wells Fargo pulled ahead of HSBC in terms of market cap (Wells Fargo finished 26 overall, in front of HSBC at 28).  Since the financial crisis of 2006-2007, over the last four years HSBC paid out more dividends than any other FTSE100 listed bank except one (US$27.2 billion/ $7.3b in 2011 alone).  Dividends were up +14% in 2011. HSBC's costs +10% in 2011 due to, among other things, wage inflation (a new bank fee charged to it by the UK government in the amount of $570m.  Underlying costs now account for 61% of revenue up from 55% in 2010). North American operations accounted for only 0.5% ($100m) of HSBC's profit before tax (compared to 2.4% = $454m in 2010).

North American business has become a bit more risky as it now accounts for 22.8% of the company's risk-weighted assets ($337.3m, up from $330.7m in 2010) even though the region represents only 19.7% of total assets ($504m out of $2555.6m). Many of the bank's key financial metrics were up on the year, however there were a couple that weren't; Down were: Underlying profit before taxation: -6% to $17.696 billion, total loans and advancements -2% to $940 million. Good decreases: Ratio of loan impairment chargest to total operating income down to 13.8% from 16.9% in 2010 and 31.7% in 2009.

Thursday, August 25, 2011

Investing In Gold and Silver Physical Gold or Stocks and Which Companies To Look For (production by company)

&nbsp&nbsp When high inflation follows the beginning of a recession, they combine to produce long term stagflation making true hedges against inflation harder to come by due to the compound effect and its impact on currency markets. (high inflation in the world's developing economies is one of the key factors propping up long term gold prices) Currently, a number of the world's major economies find themselves in that situation and that's threatening to destabilize the world economy; Because of the changing face of the world's economy (relatively new sectors like the Quaternary playing a larger, central role), the way people do business and most importantly the much more deeply rooted connections nations have with each other, history can't be used as a guide for people looking for answers. Though risky, during the year, bonds have had the second highest rate of return second only to gold (price of gold up 43.93% or $527.70 (August 9, 2010 - August 9, 2011). The market volatility, inflation and overall economic tightening are errily reminiscent of the 2008 recession, the big problem now though is that the US government has used up most of its arsenal (quantitative easing, stimulus) leaving it highly vulnerable.

What is certain is that when money devalues, commodities like gold, silver and oil don't. Gold and silver have intrinsic value that isn't easily replaced (few substitutes); their properties are valued both economically (industrially) & aesthetically and according to history, are reliable stores of money (gold was used as legal tender even before the first coins, silver use in rfid scanners and tracking devices is one of the sources of demand growth). Also, overall base metal production has been falling, at the same time central banks which used to be net suppliers have become net buyers. Countries like the United States have become increasingly reliant on quantitative easing to stimulate the economy; Quantitative easing has as a direct consequence the devaluation of curency which contributes more to inflationary pressures (if the effects aren't felt immediately they ultimately do later on when the economy heats up).

U.S. deflation is part of the reason quantitative easing is such an attractive option (increasing the money supply lowers interest rates which raises prices through foreign currency markets) however the root of the deflation America is attempting to correct isn't even a result of high interest rates (more recently) or a money supply problem meaning the government may just be creating a new problem. (thetombstonenews: 'Quantitavie Easing') Some interesting facts about gold: 3/4 of all the gold ever extracted from the earth was mined after 1910. South Africa was the largest producer in most years since that time. Switzerland was the last country to tie its currency to the price of gold (1999). Until May 2009, all the gold ever extracted amounted to 5,835,876,025.6 ounces or about 85% of an ounce per person (165,446 tonnes). Gold weighs 19.3 times as much as water, is even more rare than diamonds, never oxidizes (maintains its shine), and in its more natural form is one of the softest metals.
When deciding on Gold ETF's/Gold Stocks consider this : contracts like the precious metals loan device (government/central banks) and those made by NYMEX/COMEX and London Precious Metals Clearing Limited (involves 6 big banks including JP Morgan) are short by a significant margin when it comes to the amount of gold and silver they need to cover those positions. Also, JP Morgan is now owner of a vault license, throwing more uncertainty into the equation as JP Morgan has used unallocated gold and silver to cover contracts. Though riskier, gold stocks also pay dividends annually or quarterly, in 2011 Q2 Barick Gold's African subsidiary doubled its dividend up to 3.2c/share for the quarter alone. or consider Palladium investing

Wednesday, July 6, 2011

Investing In Gold and Silver Physical Gold or Stocks and Which Companies To Look For (production by company)

When high inflation follows the beginning of a recession, they combine to produce long term stagflation making true hedges against inflation harder to come by due to the compound effect and its impact on currency markets. Currently, a number of the world's major economies find themselves in that situation and that's threatening to destabilize the world economy; Because of the changing face of the world's economy (relatively new sectors like the Quaternary playing a larger, central role), the way people do business and most importantly the much more deeply rooted connections nations have with each other, history can't be used as a guide for people looking for answers. Though risky, during the year, bonds have had the second highest rate of return second only to gold (price of gold up 43.93% or $527.70 (August 9, 2010 - August 9, 2011). The market volatility, inflation and overall economic tightening are errily reminiscent of the 2008 recession, the big problem now though is that the US government has used up most of its arsenal (quantitative easing, stimulus) leaving it highly vulnerable.

What is certain is that when money devalues, commodities like gold, silver and oil don't. Gold and silver have intrinsic value that isn't easily replaced (few substitutes); their properties are valued both economically (industrially) & aesthetically and according to history, are reliable stores of money (gold was used as legal tender even before the first coins, silver use in rfid scanners and tracking devices is one of the sources of demand growth). Also, overall base metal production has been falling, at the same time central banks which used to be net suppliers have become net buyers. Countries like the United States have become increasingly reliant on quantitative easing to stimulate the economy; Quantitative easing has as a direct consequence the devaluation of curency which contributes more to inflationary pressures (if the effects aren't felt immediately they ultimately do later on when the economy heats up). U.S. deflation is part of the reason quantitative easing is such an attractive option (increasing the money supply lowers interest rates which raises prices through foreign currency markets) however the root of the deflation America is attempting to correct isn't even a result of high interest rates (more recently) or a money supply problem meaning the government may just be creating a new problem. (thetombstonenews: 'Quantitavie Easing') Some interesting facts about gold: 3/4 of all the gold ever extracted from the earth was mined after 1910. South Africa was the largest producer in most years since that time. Switzerland was the last country to tie its currency to the price of gold (1999). Until May 2009, all the gold ever extracted amounted to 5,835,876,025.6 ounces or about 85% of an ounce per person (165,446 tonnes). Gold weighs 19.3 times as much as water, is even more rare than diamonds, never oxidizes (maintains its shine), and in its more natural form is one of the softest metals.

When deciding on Gold ETF's/Gold Stocks consider this : contracts like the precious metals loan device (government/central banks) and those made by NYMEX/COMEX and London Precious Metals Clearing Limited (involves 6 big banks including JP Morgan) are short by a significant margin when it comes to the amount of gold and silver they need to cover those positions. Also, JP Morgan is now owner of a vault license, throwing more uncertainty into the equation as JP Morgan has used unallocated gold and silver to cover contracts. Though riskier, gold stocks also pay dividends annually or quarterly, in 2011 Q2 Barick Gold's African subsidiary doubled its dividend up to 3.2c/share for the quarter alone.

Also consider that the rise and fall of stocks isn't entirely determined by commodity prices. Other factors such as the enterprise value (see Yamana Gold blog entry), free cash flow (cash flow minus capital expenditure) and most importantly total cash cost per ounce (the main reason Canadian companies like Goldcorp and Eldorado Gold make it to the top in terms of market value while others like AngloGold and Gold Fields which produce and own a lot more than their counterparts, aren't ranked significantly higher) tend to have more of an effect on prices. There are many examples of gold companies that have a market value close to what it was 2 years ago despite commodity prices being many times higher; there was less than a 30% difference in market value for Agnico-Eagle Mines, Yamana Gold, Gold Fields, Kinross Gold (not considering the Red Back acquisition its capitalization was actually steady) while others like First Majestic Silver realized the change in price (was worth US $215 million in 2008 ten times less than in 2010 despite only producing 1.89 times less silver). Also, consider this: For most of 2008 when gold prices started their overall upward trend, it was the large cap companies that outperformed the small cap; the opposite was true in the summer of 2011 when gold prices broke through new levels, the change in behavior might simply be the result of a much higher support level for gold prices making high production costs less of an issue for startup companies (many more juniors entered the market in 2011 than in 2008). Physical gold and physical silver remains the safest investment option as there is less risk (no concerns regarding delivery of the asset) and the investor gets to realize 90-100% of the rise in gold and silver prices (on demand price paid by bullion dealers at coins stores for the metal). What the physical gold investor loses out on are dividends paid out by gold mining stocks. A major factor affecting spot prices, which is unrelated to stocks are margin calls. For example in early August of 2011 (when there was a lot of economic uncertainty) gold and silver spot prices declined at the same time major stock indices fell by their largest margins since the 2008 recession, the commodities selloff was sparked by a margin call (temporary selloff due to traders being required to meet call options). Recently, South Korea, Thailand and even debt-laden Greece added more gold to their reserves. (Gold Cartel losing, price to top $3000) On August 8, 2011 when stocks performed poorly, gold spiked again (gold is the first thing central banks/banks/investors hoard when they want a stable investment medium, also when banks realize they might have to fulfill their significant short positions) but don't be concerned about the more gradual silver rise (historically, silver has lagged gold (time) when increases occur; the reason is that banks and large investors tend to wait until gold gets too expensive before buying the white metal); also when gold gets too expensive jewelers, industrials turn to alternatives and silver is one of them. Also consider the gold/silver ratio which is 44 (August 8, 2011), much higher than the historic ratio of under 20. Silver has, in just 5 years gone from $14/oz to a support level of between $34 and $40 per ounce.

Goldcorp (GG), the lowest cost per ounce producer of gold among tier 1 companies. In 2010 it produced 23 million ounces of silver giving it the distinction of leading producer of silver among gold companies that year, though production was still only about half of BHP Billiton's (46.6 million ounces) it was high enough to rank 4th among all companies, ranking just behind Pan American Silver (24.3 million ounces). What's more, 77% of Goldcorp's 2P silver reserves (1.0 of 1.3 billion ounces) are at Penasquito, Mexico, a property that hasn't even reached commercial production yet.

First Majestic Silver (FR) has significant resources that don't show up as reserves because of their status, has one of the lowest cash costs industry-wide, nearly doubled silver production in 2010 and mints its own bullion bars and rounds (unlike many of its competitors like Pan American Silver which produce and market bullion through other companies (Northwest Territorial Mint for example).

Silver Standard Resources (SSRI) is another to keep watch of. The company is already a major producer and that's with only 1 of its 4 properties producing. Cash costs are still high because many new mines have high initial production, initial construction and other development costs.

Hecla Mining Company - The gold to silver ratio remains high (about 43 compared to 35 on May 3, 2011 (Silver 44, Gold 1540)) but is starting to come down; August 19-22 gold was up about 5.5% but silver was up more than 9%). Hecla Mining, like many other silver miners, has suffered from volatile prices since silver recorded a high of about $49/oz on April 29, 2011 however with gold about 20% higher than it was at that time and silver 10% lower, silver should eventually break through into the $50 level again. Hecla Mining has high growth potential relative to other silver miners because its fall over the last couple months has been more pronounced (as of Monday morning Aug 22; -33% last 6 months, -11.6% last 3 months, -13% last month compared to Coeur d'Alene (-6.7%, +.24%, -8% respectively) and Silver Standard Resources (-3%, -9%, -12.6% respectively); during that period First Majestic released reports confirming growth in production and earnings in 2010 and 2011 (71.8% rise in silver production in 2010 with cash costs among the lowest industry-wide (near $7/oz) compared to $12/oz for Pan American Silver (largest pure-play silver producer). Hecla also has low net cash costs realized (-$1/oz in 2010).

Primary silver producers (2010)

Fresnillo (38.6 million), Pan American Silver (24.3 million), Silver Wheaton (23.865 million up 37%) Coeur d'Alene Mines (16.8 million), Hecla Mining (10.566 million down 3.8%), First Majestic Silver (6.56 million up 72%), Silver Standard Resources (6.302 million up 48%) and Silvercorp Metals (4.624 million up 10%). (individual company notices)