Showing posts with label Earnings. Show all posts

Tuesday, March 29, 2016

Stocks to Watch 2016 Valeant Pharmaceuticals nyse:VRX Sobeys tse:EMP.A undervalued

Valeant Pharmaceuticals nyse VRX


philidor, valeant pharmaceuticals, valeant, undervalued companies, undervalued, stocks, drug sales, diversified, sobeys earnings, price earnings ratio, stock price, nyse, new york stock exchange, drug pricing,
Although the specifics regarding Valeant's problems won't be aired out until the company releases it's 10-k annual report in April of 2016, it's safe to say the stock has borne the full brunt of investor scrutiny (high institutional ownership has been a factor).  The biggest risks here on out are revenue growth, write-offs, and lawsuits - but even in a worst case scenario there is no way these three will severely impair earnings for two or more quarters.  Valeant continues to own a number of game changing drugs and products - a non-ownership relationship with Philidor doesn't change that !

revenue stream remains strong this will be key in keeping operating costs per unit within reasonable levels.

- xifaxan is approved
- diversity of portfolio
- global exposure - problems in the USA do not affect Valeant's ability to affect/control prices in other countries.
- sales in China since 2013
- ranks high among diversified companies

Sobeys tsx:EMP.A


The large quarterly write-off related to the Safeway assets should be seen as a one time occurrence; the affect on future earnings is being exaggerated.  This makes it a stock to watch in the second half of the year.

A recovery in the price of oil (will average $45 this year and $72 in 2017) will be a boost to Alberta's economy - big Canadian companies have been able to withstand volatility more than shale companies south of the border/rig count down in USA = less oil glut in North America = more opportunity for Canadian oil price to close gap with WTI.  Since acquiring Safeway, Sobeys has been the number one grocery chain in Alberta.  For the first three months of 2016 calendar year same store sales +0.4% chain-wide despite being up +2.7% in its base of eastern Canada.  2016 has thus far been an extremely volatile time for Alberta's economy (keystone pipeline rejection/oil price dropped to historic low/oil companies slashed capital spending); it is likely that the situation will improve later on this year and into next year.

  • price/earnings ratio greatly undervalued versus alternative stocks Loblaw Companies, Metro Inc.
  • book value per share is at a discount.


Royal Bank of Scotland Group plc


Since coming off one of its worst earnings quarters in the bank's history the stock is off 30%.  The write-offs which hampered the stock last year will become less of a burden in the future thanks to

  • time deadline for claims related to mis-selling scandal (risky loans, payment protection insurance in US) now almost a decade old
  • 1.5 billion pounds of the latest write-down relate to a settlement with the US Federal Housing Agency for mis-selling of mortgage backed securities
so expect these write-downs to become smaller over the next 1-2 years which will allow the bank to return to profitability - and perhaps even start paying a dividend.

Risk is not a major factor - the bank is 73% backed by the British government.

Thursday, April 30, 2015

Increasing Oil Production in Canada Despite Price Plunge oil sands, China Revises Gold Reserves renminbi

Like their Saudi Arabian counterparts Canadian oil producers appear to be concerned with maintaining their share of the market, even at the expense of earnings - At a time of record low realized prices, Canada exported a record 3.11 million barrels of oil in January - 13 per cent more than it did in January of last year, and 80% more than in 2010.
Even with a collapse in oil prices Canadian oil production - driven by activity in the oilsands, is expected to increase by 150,000 bpd this year and by that same amount again next year.  Canadian Association of Petroleum Producers

According to ARC Financial, the number of wells drilled in Western Canada will be down 50% this year as compared to last (5,300 vs 11,222).  Though production keeps rising, companies remain burdened with higher than acceptable costs.
- estimates suggest as many as 30,000 workers have lost jobs in Canada’s oil and gas industry since the downturn began last fall.

china, china imports, yuan, renminbi, renminbi yuan, renminbi exchange, currency swap, currency reserves, foreign exchange, gold reserves, china reserves, china disclosure, africa, china gold, china gold reserves,
Keeping production up when oil prices are down is much easier for Iran and Saudi Arabia to do than it is for their western counterparts
  • low-cost oil reserves in Saudi Arabia vs high cost reserves in Alberta (Alberta oil) and us shale (North Dakota shale)
  • Canada’s reserves may be as massive but they are much more expensive to extract from
  • This appears to have had more of an effect on producers south of the border (where shale exploration has officially stalled) than in Canada .. Canadian companies have huge cash reserves which they are they able to dip into when prices get too low .. and so they are able to fund core projects until new cost cutting measures take effect.


According to the latest quarters as of May 2015 company earnings are way down - earnings losses mount in Canada


Suncor Energy Inc (SU) -  1Q15 $(341) million loss or 24 cents per share vs $1.485 billion or 101 per share in the previous year.
Oil Sands operations production was 440,400 bbls/d in the first quarter of 2015, compared to 389,300 bbls/d in the prior year quarter, primarily due to minimal maintenance activities in the first quarter of 2015. Production highlights included 346,500 bbls/d of SCO due to strong upgrader reliability, and record production of 188,700 bbls/d at Firebag.  Cash operating costs per barrel for Oil Sands operations decreased in the first quarter of 2015 to an average of $28.40 per barrel (bbl), compared to $35.60/bbl in the prior year quarter, due to increased production and lower costs as a result of lower natural gas prices,Suncor's share of Syncrude production of 35,200 bbls/d in the first quarter of 2015 remained comparable to the prior year quarter production of 35,100 bbls/d.

UK has lowered its tax rate on oil profits made in the North Sea ! At suncor this saved the company $406 million (62-> 50%).


Cenovus Energy Inc (CVE) - Oil Sands production is up 20% (to 144,000 bpd) but the company endured a massive $668 million quarterly loss recently attributable to the decline in the realized price of oil and natural gas (-47% -> $37.66; -25%-> $4.47).  In the quarter just prior to this one the loss was $472 million.

Top Producers of Shale in North Dakota (Bakken)

  • Whiting Petroleum Co. (NYSE: WLL) - quarterly production 1.6 million barrels (19% of company production)
  • Continental Resources Inc. (NYSE: CLR) - 127,788 bpd
  • Hess Corp. (NYSE: HES) - 63,000 bpd (85% of company production)
  • Statoil ASA (NYSE: STO) - 50,000 bpd (9% of company production)


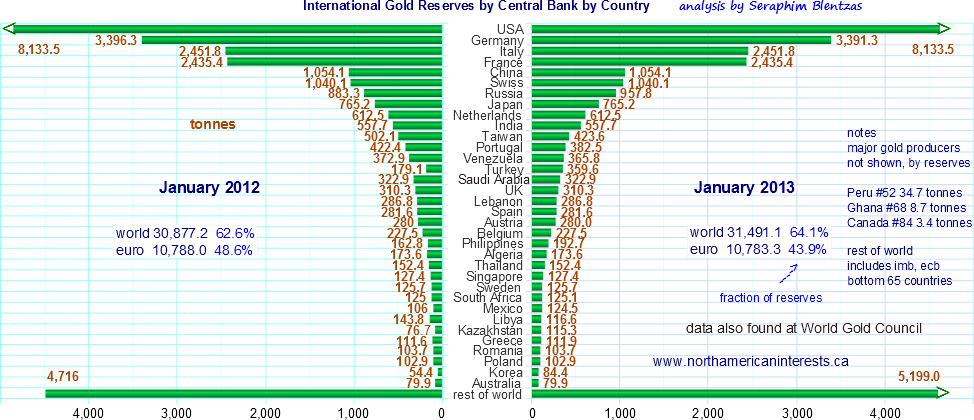
China Revises Gold Reserves (October 2015: China reserves)

- First time in four years China says anything about its reserves
- According to Wood Mackenzie China has 30,000 tonnes of gold, more than any other country.
Since the middle of the last decade China has been leading all countries in terms of gold output - very little of that actually leaves the country.. add to that the fact that China imports another 1000 tonnes of the yellow metal through various ports (HK being the largest) and you can start to see the potential it has to accumulate massive reserves.

  • Gold withdrawals from the Shanghai Gold Exchange hit a record high of 620 tonnes in the first three months of 2015. 
  • Private consumption in China is probably not that high meaning at least a portion of that is going to China's central bank.  Current estimates put China's reserves at just over 1000 tonnes, far behind the top four countries which have a combined 16,500 tonnes.

  • According to various sources out of China, the upcoming report will act to bolster China's currency - This gives foreign currency traders (and governments) more confidence in the yuan-renminbi as an alternative to the US dollar.

  • China and Brazil have already signed a $30 billion currency swap agreement.

Tuesday, March 31, 2015

Bearish Signals Make These Diversified Companies Ripe For The Picking, Royal Gold, Vale SA, Magna MGA, Gold Silver Industry

Seabridge Gold (SA) - Where else can you get 40 million ounces of gold and nearly 300 million ounces of silver with molybdenum to boot for only $286 million ? The company has more gold reserves than Russia !

gold stocks, silver stocks, auto industry, magna international, bearish signals, gold industry, silver industry, gold mining, vale sa, royal gold, stable business, diversified companies, less risky, earnings, revenue,
Royal Gold (RGLD) - despite a crash in metal prices net earnings have been relatively stable; first quarterly loss in years occurred last December and at $6.5 million it isn't anything to be concerned about.

  • stable business model
  •  cash equivalents up 200% last two years
  •  current assets up 90%
  •  over the same time frame total debt has barely changed 

-> take note however that unusual expense is up, surpassing $26 million last quarter after being nearly non-existant in previous periods.  watchout for mine writedowns.

Vale SA (VALE) - This company is trading at a 52-week low which is what caught my attention.
- maintains high quality mines around the world - diversified exposure makes it less risky (diversified companies).  Vale is a hortizontally and vertically integrated company meaning that it owns the infrastructure and controls key logistic services used to transport mined materials.

Potash, fertilizers are staples in farming - when basic metals such as nickel and copper aren't performing you can always rely on the sale of material needed to grow food.

Over the last year, Vale (nyse:VALE) is down 58%, compared to only 23% for Rio Tinto (nyse:RIO) and 30% for BHP Billiton (BHP) despite similar circumstances affecting all three companies - don't see why Vale stock should continue to be punished.

Rio Tinto - Mega project Oyu Tolgoi is entering a second developmental phase (first one already reached critical production 733,700 tonnes last year (metal sales +$1.6 billion).

The second phase is worth $6.5b but calls for $4b in project financing for construction.

Safe stock pick of the month : Magna International (nyse:MGA)

Thanks to low oil prices and the cheap Canadian dollar Magna has gained a competitive edge - latest quarterly revenue was up $220 million (+2.4%) despite a 10% decline in vehicle sales.  Net earnings were also up to $509 million quarterly (+11.1%) or $2.44 a share.  on the year the bottom line was even better (per share $6.76->$8.69).

Because of these results, quarterly dividend was upped to 44 cents (16%).  
Take advantage of these results before the company goes through with a planned stock split later next quarter.

Friday, November 16, 2012

Bombardier Results Investor Analysis, Aircraft Deliveries Orders, Flexity Trains cs100 Jets

            Bombardier Inc (TSE:BBD.B) is a rare company in that it holds the disctinction of being both the world's largest train maker and the world's #3 manufacturer of aircraft.  The Germany-based train division dubbed Bombardier Transportation remains slightly more important to the company financially, however the gap is closing fast;  For the nine month period ended October 2011, sales of trains and related services accounted for 53% of company revenue and 59% of ebit - however during the nine month period ended September 2012 that fell to 49.8% and 54%, respectively.  Bombardier puts the blame squarely on European demand (lower activity/contracts reaching completion not being filled by as many new ones) which it says accounts for 88% of the decline in rail car sales (9-month period). 

I'm still optimistic about the Transportation division !  In China and Russia, demand for trains developed by Bombardier will inevitably go up due to key license agreements signed with major rail equipment companies in China (CSR Puzhen) and Russia (manufacturer Uralvagonzavod).  As well, business from North America is on the upswing which bodes well for Bombardier - 3Q revenue from North American customers was $373m (+17.7%) and $1,095m (+7.0%) in the nine month period.  Also, revenue from Asia-Pacific which was down considerably during the first two quarters, recovered strongly in the third when it increased by +31.3% qoq (still down -42.9% in 9M2012 but that's due to uncharacteristically low sales in the first two quarters).  Total company backlog as of September 2012 is $58.6 billion up +8.7% or $4.7 billion in just the last nine months:  44.5% aerospace, 55.5% trains.

Aircraft revenue is stable, which is a great sign considering more than $200 million worth of aircraft deliveries was postponed until the fourth quarter.  The postponement of the CS100 first flight by half a year (Jan 2013 to June 2013) is discouraging but nothing to be too concerned about;  The two larger aircraft manufacturerers, Boeing (787 Dreamliner) and Airbus (Airbus A380) ended up releasing their latest larger models three years behind schedule --> Bombardier's 100-149 passenger CSeries planes will compete directly with the Airbus A320 and Boeing 737.

The company remains a force in the manufacturing industry.  Its customer base remains diverse (Saudi Arabia was the biggest rail customer this quarter), it keeps innovating (Learjet 70 and 75 programs launched in May 2012, continuance of Learjet 40 and 45) and getting its jets certified in key geographic regions which gives it a competitive advantage (in June 2012 awarded aircraft type certification for the Q400 aircraft for operation in Russia).  There's also the well known fact that Bombardier's new planes are lighter and 20% more efficient on fuel.

Net profit remains stable and orders keep coming in !  

Monday, September 3, 2012

20 Largest Banks & Financial Institutions in the World Globally as of September 3, 2012 (revenue, assets, deposits, hsbc, icbc, fiscal, capitalization)


Banks are ranked by most recent financial data, revenue, assets, earnings, market value.  TD Bank data is from the February to July 2012 period. % change in market value over the last year represents the change in total market value.  When USA, NYSE, or ADR is shown it means the stock value was already in USD. Just missed the list: Unicredito Italiano (Unicredit Group), Assicurazioni Generali (Generali Group), Royal Bank of Canada.
           
                        A lot has happened since my last report on the banks exactly one year ago.  In May 2012 JP Morgan's CEO announced that faulty derivatives trading caused the bank to lose more than $2 billion. The news sent the stock reeling, in after hours trading that day the company lost more than 11% of its market value. The loss is significant because that's about the same amount of market cap that separated it from the other top valued financial institutions.

Canadian banks are aggressively pursuing acquisitions ! Between 2008 and May 2012 Canadian banks spent $37.8 billion on ~100 acquisitions which is impressive considering big banks like Citibank and BNP Paribas were trying hard to sell off assets.  To put things into perspective, between 2001 and 2008 Canada's six big banks spent $38.0 billion on acquisitions meaning that today they are spending at roughly twice the rate they used to. One thing to consider though is the fact that a lot of their recent acquisitions bolster their position in Canada rather than overseas;  95% of the purchases they made between 2001 and 2008 were abroad.  So far in 2012 some of the biggest Canadian deals were made by TD Canada (acquisition of MBNA Canada) and more recently the Bank of Nova Scotia (August 31, 2012 closes deal with ING Groep for ING Canada, paying only $1.9 billion net in cash for 3% of the Canadian market for retail banking).  ING used the money to help pay off a government bailout it received a few years ago. That's pretty much it for ING in Canada, if you remember, back on May 13, 2009 ING sold all of its share in ING Insurance to institutional investors for $2.2 billion. Today, that 70% share is worth about $5.5 billion. Why is ING so eager to get out of Canada ?

In the summer of 2012, the Agricultural Bank of China lauched its Canadian operations in Vancouver.  Chinese institutions clearly want a piece of the Canadian market but is it too little too late ?  Canada's retail banking market is already highly congested meaning that Chinese banks will probably have to attempt a takeover or two if they really want to be a player.  Afterall, the first takeover of of a US bank by a Chinese one (ICBC) happened only four months ago on May 9, 2012.  ICBC paid $140 million for 80% of the Bank of East Asia (13 American branches).  ICBC (Industrial and Commercial Bank of China) reported in its 2Q2012 report a rise of 36.6% in the value of its overseas assets in only six months !  ICBC assets abroad are now worth US$ 166.6 billion.  Since the US Fed approved the deal, three Chinese banks are now permitted to operate in the United States.

In China, payment delays are becoming more problematic especially in the mining sector (debt owed to machinery companies up significantly). That's causing headaches for the big four banks there which have seen their market capitalization drop off quite a bit from last year's highs.  More of the loans on their books are becoming risker and investors are taking notice.

Royal Bank of Scotland: I excluded it from my list last year and again this year.  This year the bank's problems go beyond just the unending quarterly losses.  The company's market value remains pennies on the dollar at just over US$20 billion which is lower than it was at this time last year. The bank remains mired in problems which include conflicts of interest, rigging of inter-bank borrowing, IT malfunctions, problems in Ireland. The bank's market cap has been erratic as of late.  It's also 83% owned by the British government.

World's 21 leading financial institutions with data from last six months as quoted in company reports (using domestic currency):  click on link for company interim 2012 report (in the case of TD Bank it's the 2nd + 3rd qtr ending July 31, 2012)

Bank Assets Revenue Net Income
June 2012 June 2011 % chg 1H12 1H11 % chg 1H12 1H11 % chg
ICBC 16,431,196
(mar'12)
14,896,048 +10.3% 258,900 231,160 +12.0% 123,200 109,600 +12.4%
HSBC 2,652,334 2,690,987 -1.4% 43,672 42,311 +3.2% 9108 9762 -6.7%
ConstrBank 13,505,745 11,754,766 +14.9% 227,812 197,246 +15.5% 106,494 92,953 +14.6%
JP Morgan 2,290,146 2,246,764 +1.9% 48,232 52,000 -7.2% 9884 10,986 -10.0%
AgriBank 12,112,888 10,725,141 +12.9% 210,780 184,633 +14.2% 80,522 66,679 +20.8%
BO China 12,825,590 11,483,498 +11.7% 179,665 165,974 +8.2% 75,002 70.234 +6.8%
Citigroup 1,916,500 1,956,600 -2.0% 38,048 40,348 -5.7% 5877 6340 -7.3%
BO America 2,190,868 2,338,826 -6.3% 44,246 40,113 +10.3% 3116 -6777 up
TD Bank 806,283 713,642 +13.0% 11,591 10,540 +10.0% 3396 2894 +17.3%
Itau Unibanco 888,809 793,679 +12.0% 40,183 35,821 +12.2% 6729.8 7132.5 -5.6%
Santander 1,292,677 1,231,908 +4.9% 22,544 21,403 +5.3% 1704 3501 -51.3%
AIG 555,383 610,427 -9.0% 35,566 34,119 +4.2% 5788 3554 +62.9%
BNP 1,970,041 1,983,154 -0.7% 19,984 22,666 -11.8% 5082 5246 -3.1%
Goldman Sachs 948,638 936,910 +1.3% 16,575 19,175 -13.6% 3071 3822 -19.6%
UBS 1,412,043 1,419,162 -0.5% 12,934 15,515 -16.6% 1252 2822 -55.6%
Lloyds 961,371 978,951 -1.8% 8,965 10,868 -17.5% -641 2278 up
Barclays 1,631,265 1,492,922 +9.3% 15,475 15,299 +1.2% 480 1983 -75.8%
Deutsche 2,241,174 2,164,103 +3.6% 17,214 19,014 -9.5% 2063 3363 -38.7%
ING Groep 1,237,248 1,240,731 -0.3% 7,759 7,137 +8.7% 1851 2888 -35.9%
IntesaSan 666,417 644,673 +3.2% 8944 8720 +2.6% 1274 1402 -9.1%
SocGen 1,246,666 1,158,008 +7.7% 12,583 13,122 -4.1% 1405 1897 -25.9%


Highlights and Some Key Data To Keep In Mind:

Industrial and Commercial Bank of China
Revenue growth outpaced growth in operating expenses (13.7% vs 12.6% for the half) and that pushed the cost to income ratio down to 25.57% which is a first half record low.  EPS 0.35 RMB up from 0.31 RMB qoq.
On July 6, 2012 ICBC announced the closing of the acquision of 80% of the Bank of East Asia, a deal that gave it a foodhold in the US market.
By June 30, 2012 ICBC middle east operations already surpassed their 2011 full year earnings.
S&P has a slightly higher rating of the bank vs Moody's (outlook positive vs stable). 
June 2012:  ICBC is present in 34 countries, overseas asset value at US$ 166.6 billion +33.6% since December 2011.

Banco Santander
Profit from continuing operations was €3472m down only 11.9% from (€3940m).  The real profit decline of 51.3% --> €1704m is due to the setting aside of €1,304 million in the 2Q12 in provisions for property (real estate exposure in Spain);  That reduced 2Q12 net income from €1,404 million --> €100 million.

American International Group Inc. AIG
Insurance premiums contributed 53.6% of revenue ($19,080m / $35,566m) which is down from 56.8% in 1H2011 ($19,380m / $34,119m)

Deutsche Bank
In euros, assets (+3.56%) and deposits (+0.61%) went up in value but because the euro lost -8.19% of its value relative to the USD when denomited in dollars both experienced a decrease in value.

Societe Generale
Asset value actually went up +7.66% however the euro lost -8.19% of its value relative to the USD and that caused SocGen asset value to fall slightly when denominated in dollars.

Agricultural Bank of China Breakdown of Customer Deposits 
June 30, 2012:  53.4% are demand deposits (28.3% individuals / 25.1% corporate), 41.4% time deposits (39.8% individuals / 11.6% corporate), rest are other.
June 30, 2011:  57.4% demand deposits (28.6% individuals / 28.8% corporate), 38.9% time deposits (28.7% individuals / 10.2% corporate), the rest are other.
Revenue is quoted as operating income, customer deposits are referred to as Due to Customers.

China Construction Bank
EPS  basic and diluted are the same, 0.43 rmb up from 0.37 rmb
The bank's cost to income ratio down to 32.73 from 36.19 year ending December 31, 2011
Customer deposits breakdown:  June 30, 2012:  51.2% are demand deposits (18.3% personal / 32.9% corporate), 48.8% time deposits (27.9% personal / 20.9% corporate), rest are other.
June 30, 2011:  53.5% demand deposits (18.5 personal / 35.0% corporate), 45.2% time deposits (26.7% personal / 18.5% corporate), the rest are other.

Toronto-Dominion Bank
TD's 3Q2012 was one of the best on record;  EPS (basic) up to $1.92 from $1.84 in 2Q2012, $1.77 in 3Q2011.  Though the company's bottom line was much improved, it didn't result in any dividend hikes (still at 0.72 q2q, but up from 0.66 last year).
For the recent third quarter wealth and insurance net income was +3.15% --> $360 million (21.1% of total group profit).
In just the last 3 months TD's total assets are up +4.28% !
Revenue grew +1.6% between April 2012 (2q) and July 2012 (3q) compared to 5.2% between April 2011, July 2011.
Only 16% of its wealth and insurance net income comes from its ~ 30% stake in TD Ameritrade.
In 2012 TD acquired MBNA Canada.

About the table at the top of the article, currencies used*Average fx rate calculated myself using data at x-rates.com and google finance exchange.
Exchange rates used to convert to USD for the 6-month period (used for customer deposits, revenue, net income/profit)
Chinese RMB 1hfy12 0.158243255555, 1hfy11 0.1529334634 up 3.47%.
Euro 1hfy12 1.29745937777, 1hfy11 1.403703906 down 7.57%.
Swiss Franc 1hfy12 1.07705781666, 1hfy11 1.10659625 down 2.67%
Brazilian Real 1hfy12 1.86424560555, 1h11 1.6312765625 down 14.28%.
British Pound 1hfy12 1.57693847777, 1hfy11 1.61702795275 down 2.48%.
Canadian Dollar 1hfy12 1.00605145856, 1hfy11 0.9704058232 down 3.67%

Currencies used for assets last day of most recent reporting period
Chinese RMB   June 30: 2012  6.3550, 2011 6.46350
                           March 31, 2012 6.29700  (ICBC)
Euro  June 30: 2012   1.266350,  2011   1.451931
Swiss Franc  June 30: 2012  0.947650, 2011   0.84160
Brazilian Real  June 30: 2012   2.00950, 2011  1.560491
British Pound  June 30; 2012   0.636679, 2011   0.62250
Canadian Dollar  July 31: 2012   0.955100, 2011   0.955100

Monday, July 2, 2012

Sobeys (EMP.A) Did Well in 2012 Even Compared Loblaw Companies LTD (L), Metro Inc (MRU.A)

Empire Company Ltd (tsx:EMP.A) is the parent of Sobeys Stores Limited, the food retailing unit which contributes 99.0% of revenue to the Empire Group (up from 98.3% in 2011 due to the divestment of Wajax property business but that will change next year due to the inclusion of 236 more gas stations as part of operations). Empire Company is still looking like a solid investment (ebitda margin grew the most out of the three companies however it's still in 3rd place at 5.5%).

It upped its dividend payout to 24 cents a share from 22.5 cents which represents an impressive +6.7% jump (had been 20c for a number of quarters prior to that). That beats Loblaw companies LTD last quarterly dividend payout of 21 cents a share back on April 30, 2012 (no growth quarter on quarter) and 21.5c at Metro Inc (up 12.0% from 19.2c which is a nice return). Metro had no problem hiking dividends, with earnings per share up +12 cents (82-->94c) compared to +14 cents at Empire Company (121-->135c) and -13 cents cents at Loblaw Companies Ltd (58-->45c).

Same store sales: Metro 2Q12 (March 2012) +1.0%; Loblaw Companies (march 24, 2012) -0.7%, Empire Company (June 2012) +0.7%


Although sales were down slightly in the last quarter of 2012 (-1.8%), after accounting for the period length being 1 week shorter empire's total sales were actually up +3.0% or $474.9 million (fiscal 2012 only 52 weeks vs 53 weeks in fiscal 2011). Sales were also +3.0% higher for the year after accounting for 2011's extra week & the impact on sales resulting from acquisitions & divestments of convenience stores/gas stations (sales difference between 2011 and 2012 goes from $290m --> $474.9m). Empire Company's EBITDA (unadjusted) ended 2012 on a strong note, up +$14.4m over last year's quarter compared to only +$13.6m for the entire fiscal year (meaning it actually contracted over the previous three quarters). In 4q12 only $10m ($35.3m for the year) in profit came from investments and other operations up from $6.5m in 2011. In the thid quarter, Sobeys food business contributed $3.94 billion to revenue (out of Empire's $3.98b) while in the fourth quarter it was $4.02 billion (out of Empire's $4.07b) which is about 99.0%. In terms of profit, Sobeys was the source of only 89.54% of Emipre's over the last two quarters.
Ebitda margin for last quarter; Metro Inc still leads the industry at 6.9% (up from 6.7%), Loblaws is still in second place at 5.9% (down from 6.6%); Empire Company, though last went up more than the other two: 5.5% (up from 5.06%).


Business at Empire Theatres appears to be strong with revenue from Empire's non food business up +7.2% to $50.6m (from $47.2m); Most of the revenue in that category comes from cinema operations. For fiscal 2012, that revenue reached $204.5m up from $200.5m.
$10M in ebitda gains in fiscal 2012 are attributed to 'dilution gains' from a change in ownership level of Crombie Reit. Normally it's $74.8m (vs $69.4m) but that changes to $64.6m (vs $62.6m) after removing items not considered part of underlying business.
Funded debt fell -$21.6m to just over $1.1 billion (1.3xebitda). Funded debt/total capital fell -1.7 basis points to 25.0%.

Market Share
If we base the market share each has in Canada's food retailing industry on the food revenue of each company during the last two quarters, we can assume Sobeys is at 23% if we believe Galen Weston Sr (Loblaw Companies) when he puts his company's share at 40% (Sobeys sales last six months $7.9632 billion vs Loblaws $14.034 billion last two reported quarters ending March 24). It follows that Metro Inc has 15% of the market (all of its revenue comes from food).

More information about the grocery industry can be found at another website I launched recently at www.grocerynews.org

Friday, December 16, 2011

Undervalued Blackberry Far From 'Game Over' (subscribers up 35% to 75 million, competition affects US market share)

   RIM is far from game over as implied by cnn's Paul R. Monica, not that he has a track record for giving blackberry credit when appropriate; for instance no mention of the 33% quarter to quarter increase in bb unit sales up to 14.1 million in the 3 months ended November 2011 (from 10.6 million units in the 2nd, 13.2m in the 1st quarter) putting it in record company territory or the 35% increase in subscribers over the last year to 75 million. (Globeandmail: Holding out hope in RIM’s hometown) RIM is also Canada's biggest R&D investor at $1 billion/year, Canada represents 11,000 of it's 17,500 workforce. It still holds a leading market share in Latin America 25.6% (Sept 2011, ahead of Samsung at 24%), Canada 36% (platforms, ahead of iPhone at 30.1%), Indonesia 46% (Sept 2011, 2nd is Android at 29%) & South Africa 70% (where Nokia takes 2nd place); Latin American share was also quoted as 28% in August (Argentina has all but banned iPhone sales however BlackBerries are allowed since RIM now manufactures in the country). In the UK Blackberry was in a virtual tie for 2nd place with Apple in 2011 after claiming 27.7% of the market (8.5M British BB subscribers). Another feature unique to the BlackBerry: alert settings ! Users are given more control over ringtone and volume settings as compared to the iPhone.

Things looking up for PlayBook! PlayBook now has 15% of the Canadian tablet market which is amazingly good considering it was just 5% five months ago. The change is attributable to losses in market share by Apple's iPad (now 68% from 86%) and the PlayBook becoming more affordable ($300 compared to $500 introductory price).  Later, in February 2012 Wordpress released an app that allows users to update/create blog content from the playbook tablet.  RIM still has a lot of work to do. Only about 1% of the global tablet market is held by RIM however the company is in an enviable position, the tablet market will grow by 43% in 2012 and much of the growth will come from the developing world where demand for BlackBerry products continues to be strong; First nine months of 2011 more than half of RIM's revenue came from countries outside the USA, UK and Canada (58% of RIM revenue which is up from 39% in 2010). Graphs, tables and general BlackBerry information can be found at more on BlackBerry In the first week of March 2012 BlackBerry's PlayBook outsold iPad at Canada's leading electronic retailers, Best Buy and Future Shop.

Rim is not Palm since Rim continues to have a definite market presence not only in America but globally with a 30% market share outside the U.S. (international market contributed $3.6 of $5.6 billion or 64% of revenue in the 1q12; that compares to 53% for Google) versus 9.2% within the USA (down from over 20% in 2010). Abroad, blackberry is particularly popular in Thailand (>33%) and Indonesia (46% up from 40%) where market share continues to grow even without the next generation QNX operating system being applied to any of its products as of yet (remember QNX alone is worth more than a third of RIM's market cap at present, the QNX product is unique, cutting edge with its technology already used by spacecraft and car guiding systems); In Indonesia there are 6 million blackberry users making it the most popular brand, in fact its popularity combined with a half price offering on the $540 Bold 9790 to the first 1000 buyers, was enough to cause a stampede in Jakarta in November; the strong showing for such an expensive phone is also exciting given that Rim has traditionally relied on the US market for sales of its higher end devices. Smartphones are on track to account for as much as 49.6% of all mobile device shipments to Thailand by 2015 up from the current rate of 17%, so as long as RIM maintains a top two position in that market it should see a significant boost to sales in the near future. In an effort to stem any erosion of market share RIM introduced its first touchscreen phone, the Curve 9380.

Update: BlackBerry and Java ME were the only operating systems to gain share during the month of December (keep in mind that Java ME was down for the year while BB was not); The figure considers all mobile devices even the ipad and other tablets (smartphones represent only about 25% of mobile devices worldwide).
Apple and Nokia's problems in Western Europe will give BlackBerry more opportunities which is great news for RIM considering it's not that far behind (1st quarter of 2011 RIM shipped 3.5 million blackberries to Western Europe, enough to give it a steady 16.5% market share in smartphones). 2011 saw a lot of new companies enter the handheld device market, that was enough to bring Nokia down from 1st place (40% share) to only a couple percentage points higher than 3rd and 4th place RIM and HTC (16.5% each), unlike Nokia RIM is holding onto its European market share. Android continues to dominate among operating systems, in the 2Q2011 51.9 million units were sold worldwide which represents 48% of the global market; Samsung led Android device makers at 17M.

RIM sold over 14M smartphones in the just ended third quarter which ties its record high of 14.2M in the quarter ended November 2010 (was about 25% lower than iPhone sales). For the year, Apple sold 70 million iPhones, 30 million iPads and 59 million other products. RIM also continues to attract the attention of major investment firms with NY based Omega buying up 1.43 million shares last quarter. In the just released quarter RIM posted earnings of 51 cents per share ($265m overall) and revenue of $5.17 billion in line with analysts expectations of $5.26 billion (with a 27.3% gross revenue margin/36.3% in the nine months). By comparison Motorola Mobility Solutions (mobile devices) with 38% more market cap, lost 10.7 cents per share (still independent Motorola Holdings with twice the market cap posted only 39 cents per share profit) last quarter while Nokia continues to post losses ($68m, $368m last two quarters, respectively). As of Nov. 26, 2011 total assets are $14.037b up 9.0% qoq with current assets accounting for half of all assets (down 3.8% to $7.2b but still up 20% from August 2010). As for Microsoft (the platform that Nokia has anchored itself to) it had trouble keeping even its 5.8% mobile platform market share.

RIM's encryption security, made even better in 2011 with the addition of Near Field Communications features to Java-based BlackBerry 7 Bold 9900, is so advanced the playbook, Blackberry's answer to the iPad, remains the only tablet endorsed for purchase by the US Federal Government (since July 2011). Additionally, blackberries are ten times more efficient than the competition when it comes to bandwidth usage which is one of the reasons they are doing so well in developing countries like Indonesia, where bandwidth is limited. RIM's leading edge security features
November 14, 2011: BlackBerry 7 phones awarded common criteria EAL4+ Certification meaning that the combination of security mechanisms and product design meets the highest level of accreditation. This applies directly to the BlackBerry® Bold™ 9900, BlackBerry® Torch™ 9810, BlackBerry® Torch™ 9860 and BlackBerry® Curve™ 9360. February 2012: Blackberry 7 operating system receives FIPS 140-2 (Federal Information Processing Standard) certification. The FIPS 140-2 certification for BlackBerry 7.0 and 7.1 gives the company bragging rights when it comes to encryption security. Since the award was granted all of BlackBerry's latest smartphones and Playbook tablet are now all certified by the FIPS program. FIPS is an award issued by the Canadian agency 'The National Institute of Standards and Technology (NIST) and Communications Security Establishments of Canada".

Platform diversity makes it easier for Android to compete BUT in the long term it will lead to new problems
Unlike the competition Rim is still betting mostly on its own devices and sotfware. Google is taking a more liberal approach; as long as device markers comply to the Compatibility Definition Document industry standard, they can use just about anything produced by Android. Platform diversity, something that RIM and Apple are more wary of getting into, is already beginning to have negative effects on Android in the form of Android fragmentation; Multiple phone manufacturers with one carriers apiece, simultaneously supporting more than one active version of Android. That has led to more troubleshooting problems and other hardware & software issues that are increasingly difficult to resolve due to there being less consistency across devices. Also a problem: Google can't address an issue as efficiently as say rim can because google doesn't design the mobile devices. As a result carriers are losing as much as $2B a year from phone returns/replacements; In fact during the 4Q2011 Sprint, the #3 US carrier reported a $1.3B loss, it sold 1.8 million iPhones and added 1.3M more net subscribers. There's also the issue of patents. Any patent infringement charged to Android affects all of device manufacturers that use it including market leaders like Samsung, HTC and LG.

Over the years Blackberry has improved battery life (fewer of the less popular apps, though next generation phones could require more power if they run on multi core processors), zooming/scolling (liquid graphics display), operating system speed (BB7 which runs the Torch 9810, Torch 9860 and Bold 9900 is 40% faster than BB6 and 100% faster than BB5) and screen resolution/display brightness. The company spent $369m on research & development an increase of 3.4% vs 3q2010.

For manufacturers relying on another's platform (Samsung/HTC on Android, Nokia on Microsoft) future patent laws could provide major stumbling blocks to growth; For example in late Dec 2011 Apple was granted a patent that can be used to keep HTC from bringing several of its newer Android products to the American market. That could eventually lead to other similarly used patents, severely limiting growth for companies without their own operating systems. (bgr: Apple’s new app-switching patent could be trouble for Android) Considering Rim is a patent rich company (1400 patents comprising at least $4B worth of intellectual property according to Bank of Montreal analyst Tim Long) it is in an enviable position. Google is also limited in how it handles troubleshooting problems since it doesn't design the mobile devices which run its operating system (one of the reasons Android phone replacement/repairs cost carriers over $2B a year that's much higher than at RIM & Apple. Apple update 1Q2012 - As of end of December 2012 Apple is selling iPhones at a rate of 285/minute. The company has $97.6B in cash and a 65% share of the tablet market (down from 90% a year ago). For carriers like Verizon and Sprint, carrying the iPhone is bittersweet; Since Verizon added the iPhone to its repertoire in late 2010 it has seen its ebitda margin decline to 42.2% from 46.4%, but at the same time it added hundreds of thousands of new subscribers (1.3M at Sprint).

My response to some of Paul's criticism;
Paul "There is no sugarcoating RIM's latest earnings report. The company warned that sales and profits for the next quarter will be far below already reduced forecasts."
Me - Nokia's earnings have reached nil and even google has reported reduced earnings (experienced 29% decrease q2q 1q11) proving that the success of a product is not directly related to earnings. Margins ARE being reduced industrywide (why Apple's iphone4S was rejected by the US's 6th largest carrier US Cellular because the product is not profitable, competition has reduced the profit margins significantly over the last year with new companies HTC and Samsung entering the market). Additionally, RIM's latest quarterly earnings of 51c/share also took into account a $485m loss attributable to unsold tablets & $50m loss due to the October outage, meaning smartphones didn't do all that bad (company's smartphone business makes up just over 50% of the market cap compared to just 2% for tablet division). Don't forget about the last of 2011 when Google's $864 million q2q increase in revenue actually translated into an earnings decline of 0.9% or 21M. In the same quarter, Apple's profits which amounted to more than $13 billion, actually exceeded Google's quarterly revenue by 23.4% ! Apple sold more iPhones during the last quarter than over the entire 2010 calendar year (285 iPhones sold per minute).

Paul "We now believe that RIMM needs to adopt an existing ecosystem (Windows Phone) in order to remain a relevant player in the smartphone market"
Me - Blackberry remains neck to neck with Apple in the corporate market with a near 40% market share. That means that blackberry's operating system is one of only two with widespread use in that market.
On Millenial Networks out of the top 20 handsets the ones that ran on Apple's operating system represented 12.55% of the market compared to 9.72% for blackberry. (Millennial: Android usage doubled iOS in Q3, iPad king of tablets with 456% growth). So blackberry's operating system remains a player even without the QNX upgrade. Blackberry continues to be even more relevant than Nokia and that's with Nokia (and Samsung) relying on other companies to provide them with an operating system (even Samsung doesn't run its own operating system - so if android or windows or iOS face encryption problems Samsung and Nokia can't do anything about it - can't downplay encryption security with 90% of US companies hacked in 2010).
Of the top 5 mobile original equipment manufacturers only Apple gained market share in terms of US subscribers in September versus June (10.2% vs 8.9%) proving once again that Rim is not the only company experiencing market share loss in the US (LG and Motorola lost about the same % share as Rim in the OEM category); but because the US smartphone market is still growing in size company sales aren't dropping as fast as market share would indicate. The reason it's taking RIM so long to bring QNX bb10 phones to market is because RIM has to rewrite the Blackberry Enterprise Server so that it's tailor made for QNX. Don't forget that Apple is losing market share quickly in Europe's two largest markets, Germany and France. Apple's situation in Europe is deteriorating quickly with the loss of patent wars in Germany. Though Android is gaining, particularly in the key market of France (nearing 60% market share), Apple's problems in Europe are giving companies like RIM more opportunity to expand.

Paul - Blackberry is irrelevant evidenced by earnings drop/market share drop
Me - That's an overreaction. All smartphone companies are seeing their profit margins squeezed due to higher competition (average blackberry phone price decreased from $362 in 2005 to $308 in 2010). Blackberry's sales stabilized in the 3Q of 2012 fy at $19.8B annualized (according to Brigantine) while sales of the newest Blackberries released November 15 were seen as healthy by Royal Bank of Canada. The market share drop is limited to just the US market which only accounts for 36% of RIM's revenue. Even so, the market share drop shouldn't be a concern given that blackberry sales remain near record high (quarterly) and subscribers are up 35% to 75 million in just the last year. Also to keep in mind the last quarter included $485 million in losses due to unsold tablets and another $50 million from the outage in October.
It also depends on what region you're looking at. Blackberry remains more popular than ever outside of the US, UK & Canada; Outside of that region revenue is up to $8.24B for the first three quarters of 2011 up 48% from $5.57B in the corresponding period of 2010; Meanwhile revenue from the US market was down 44% proving that BlackBerry's future lies beyond the US market. Without taking the non US market into account it's impossible to properly evaluate RIM.
What's more, Google's 1st quarter earnings drop of 29% (quarter to quarter) was not an aberration, profit in the quarter ended December 2011 fell slightly from the previous quarter ($2705m vs $2728m) even though revenue grew by $865 million.

Consider the 3rd Quarter of 2012
*According to ad Impressions RIM was the only company posing significant threat to Google and Apple in the connected device & smartphone mix on Millenial networks, with a 13% overall market share compared to 56% and 28% for iOS and Android, respectively. RIM also had the 3rd (Curve), 7th (Bold) and 9th (Torch) most popular mobile phones which combined to represent 9.03% of the market; out of the top 20 handsets the ones that ran on Apple's operating system represented 12.55% of the market compared to 9.72% for blackberry. As a manufacturer, RIM ranked 4th overall just behind HTC at 11.05% with 4.6X the market share of Nokia.

*Revenue from outside the USA, UK & Canada up 48% to $8.24B in the first nine months of the 2012 fiscal period. That region now accounts for 58% of total revenue up from 39% last year.

*Sales stabilized at $19.8B annualized for 2012. Sales of the newest blackberry models were healthy according to RBC. Sales of the newest phones don't show up until late 3Q/early 4Q meaning previous quarters didn't realize the full impact.
*Blackberry sales still at near record high of around 14m (quarter ended Nov 2011) with the lowest future forecast of 11 million (quarterly) being only about 25% lower than the record high for a quarter (meaning when bb10 comes to market sales are guaranteed to break into new record territory).
*9.2% of all handheld devices in the United States ranked top 4 ahead of Nokia, Motorola (25% of all mobile sales are smartphones)
*18.9% of all subscribers in terms of platform (study by comScore, quarter ended September 2011), Continues to have a piece of the tablet market (only 1% or 150,000 units shipped/160,000 sold last quarter however with the tablet market growing by 42% to 29 million in 2012 holding onto that 1% could mean higher playbook sales). Worldwide tablet sales increasing to as much as 253 million in 2016. The iPad2 is expected to dominate in 2012 with market share estimates ranging from 69% to as high as 90% (the rest residing mostly with Android devices like Amazon's kindle fire). Sales of RIM's playbook have been lackluster not because of a lack of interest from end users but rather because the big three American retailers Sprint, AT&T and Verizon Wireless have yet to carry it, they say the market for tablets is currently too crowded and RIM will have to wait. That has forced RIM to bear the burden of sales and marketing.

*In the three months beginning 2011 64% of RIM's revenue came from outside the US ($3.6B out of $5.6B) so a hit in its US market share doesn't mean nearly as much for RIM as it did for PALM (another reason the comparison is nonsensical). Sales of Bold 9870, Curve 3G make up a healthy fraction of total sales signifying that the high end market in emerging economies is growing.

*As an investor you have to be excited about the $1.1 billion cash on hand and zero total debt. That's basically the same position it was in a year earlier, on November 26, 2011 when the stock was 4.3X higher at $59.20/share (cash was only $300m higher at $1.435b) and its cash isn't necessarily in a downtrend; between the 2nd and 3rd quarters of 2012 fiscal year (Feb->Feb) cash on hand was up 32%. At $13 a share even the most pessimistic observers have to be somewhat curious about the company considering the sum of its parts could be as high as $15-$18/share. You also have to take into consideration the P/E ratio which is remarkably low for a company in an industry where P/E ratio's average around 16X. Neither Motorola Mobility or Nokia have reported any profit for the past couple quarters though their P/E ratios remain seven times higher than RIM's.

*Blackberry has over 75 million subscribers!!!! 35% more than it did a year ago. Its p/e ratio rock bottom at 3.90 is especially ridiculously low when you compare it to Nokia (20.48) and Motorola (20.52); it suggests that RIM has fallen far behind those companies when in fact the opposite is true; it has maintained market share and popularity (and even some earnings) despite not turning to other platform providers (specifically android and windows) when the going gets tough.
Net earnings at $256m in the three months ended November 2011, that's down from $911.11m the previous year (though sales are stable) but remember all smartphone markers are suffering in the earnings department due to profit margins being squeezed industrywide (carriers like US Cellular have rejected the iPhone4 because of profitability issues). RIM is still reporting hundreds of millions of dollars in earnings, in stark contrast to Nokia which has been operating at a loss for over half a year (-68M, -368M profit in the last two quarters respectively). During the 2011 year BlackBerry was one of only three operating systems to gain overall US market share in the mobile device category, what's more during the last month of the year it was the only one of those three (iOS, Android, BBX) to increase its share.

*In Indonesia, the world's 4th most populous nation, Blackberry remains the most popular smartphone brand with an impressive 6 million users. What's even more exciting is that high end models such as the $540 Bold 9790 'Bellagio', are gaining popularity.

Now on to QNX Blackberry 10 smartphone technology (QNX operating system, QNX technology also known as Neutrino)
*Probable that 1st QNX phones will have their own native e-mail since playbook is getting its own native BES compliant e-mail just before Colt launch.
*Next generation phones also compliant with Android apps making the apps difference (6X more at Android than RIM apps world) irrelevant.
*QNX phones will have a more fluid touch screen than even the iphone due to the application of leading edge technology (with better screen resolution). The Liquid Graphics technology utilized in the Java-based blackberry 7 already gives it seamless zooming and scrolling.
*Thinner than the iPhone, same resolution as the tablet (1024 x 600), similar resolution to the iPhone4S (16/9).

key rim stats (Dec.22 data)

* Share Price: 13.50/share (reached $14/share by the end of Friday Dec.23)
* Book Value: 19.45/share
* Cash on hand: 2.49/share
* Analyst EPS Growth Consensus: -2.61%
* Debt: No Debt
Grmike's advice - Even in liquidation mode the company is not overvalued with its intangible patents (worth as much as $5B), QNX division ($2-3B) and other assets including current assets (cash over $1B). At this point it has to be considered a value stock with high reward/little risk. Considering it still has a growing market share internatinally (30%) and that developing economies are adding millions of people yearly to their middle class (Brazil especially with nearly 20 million added last year) the RIM brand could be in for an upswing even though the US market countinues to be a hostile place for it. The smartphone and tablet market is growing in size at a rapid pace and that makes any amount of market share increasingly valuable. Look for trends in call options, when they pick up don't hesitate to buy a couple. The risk is minimal with share price so low but the reward is high and there are many cases in which a high reward would be realized. Don't underestimate the interest RIM garners as a takeover target now that Motorola is off the market, Nokia is expensive, isn't commited to developing its own independent operating system (Symbian has all but been abandoned in favour of Microsoft), is unprofitable and has no tablet. I think it's very telling that one of Research in Motion's biggest investors to date has been Jaguar Financial, a group whose sole purpose is to "invest in underperforming, undervalued or unappreciated companies".

General Commentary - China recently surpassed the US as the biggest smartphone market in terms of unit shipments (not revenue though) and Nokia still leads there (but with rapidly declining share) meaning that there's an opportunity for RIM to capitalize (if Android's Samsung, LG don't take it). Apple's still experiencing problems in Europe (not as bad as Nokia which got its share cut in half in 2011) with the iOS getting dangerously close to 20% in France and Germany meaning it recorded negative 5-10% growth over the last year, the opposite of what's been happening with Android. In Germany, Android holds 3X the market share of Apple which means a lot since Germany is Europe's biggest market. Germany has been a hostile place for Apple (just look up the patent ruling in favor of Motorola) so it could be a while before Apple makes up any of the share losses.
All is not lost for Apple abroad though. The iOS is still at over 30% in the UK (only European country that's over 30%), Japan (38%), Australia (41% and growing) and of course the United States (36% and growing). South Korea is Android dominant (85% share) while Nokia/Symbian still lead in China and Brazil but Nokia is losing market share fast as it transitions out of Symbian and over to Windows.

other info
71.1% of mobile subscribers in the United States used the text messaging services (September, up from 69.6% in June) and 31.1% of them accessed blogs/social networks (up from 29.1%).

Wednesday, October 19, 2011

Sobeys challenging Loblaw Companies' dominance in Canada's grocery market (superstore competition, provigo, no frills, loblaws)

   Between the years of 2008 and 2011, annual sales at Empire-Sobeys Ltd rose 12% to over $16B (53 weeks ended 2Q12 up from $15.5B the year prior, in the 1st qtr $4.15B up 3.2% while operating income for the qtr was stable at $150M) compared to only 4.9% for Loblaw Companies (in the 3q11 sales were 2% higher qoq, 2q11 qtr Loblaw sales didn't grow at all qoq steady at $7.27B (rev up 6% though quarter to quarter)/ income up 16m, ebit up 3m) and 0.8% for Metro Inc (fiscal 2011 $11.431B). Since 2006 the first full year that A&P Canada was part of Metro, Metro's sales have increased by only 4.3% compared to 24.7% for Sobey's; Minor boost for Sobeys came in 2007 when it acquired BC chain Thrifty Foods for $260M, for the past six years Sobeys has led the industry in same-store sales growth. Sobeys latest quarterly dividend was 22.5 cents per share. When we look at the last fiscal year annual revenue at Loblaw Cos was up only 0.3% compared to 3% for Sobeys (Sobeys 12 month period ended in May 2011, Loblaws January 2011). Most of the increase in Sobeys revenue came from 1) Larger new stores (in terms of square footage, closing the gap between it and Superstore 2) Modest inflation 3) Product/services innovation. Investments/other operations provided roughly 1.2% of revenue ($51.1M). Food retailing sales up 3.3% in the quarter (surpassing $4B to $4.106B). Consolidated funded debt fell 12.8% to $1.1004 billion. In the discount market Loblaw's No Frills leads all other grocers, just the 152 No Frills stores in Ontario made $3.4B in sales in 2010 more than Sobey's FreshCo and Metro's Food Basics combined. (June edition: Grocery Trade Review)

Food retailing market share in Canada among grocers: Loblaw Companies 43%, Sobeys 21%, Metro Inc 16%. (Atlantic Farm Focus: Sobeys to supply Target)

Sobeys same store sales growth was 1.7% in the 1st quarter of the company's 2012 fiscal year (ended August), that compares to Loblaw Companies reported 1.3% in its 3rd qtr (ended October) and -0.1% in its 2nd; Sobeys led the industry in same store sales for six consecutive years (the latest a 1.3% increase in 2011).  In the 2nd qtr Sobeys same store sales +1.9% vs +2.5% for Loblaws.  Loblaws earnings in the quarter ended October 2011 totalled $236M up 19.8% even though revenue increased only 2.0% to $9.7B, only the second quarter to quarter increase since a 3.5% decrease back in March (4Q sales grew strongly at over 3%). Loblaws revenue has been inconsistent quarter to quarter due to flat food sales and lower sales in drugstore, apparel and general merchandise. Parent Empire Company Limited has actually been controlled by the Sobeys clan since 1947 when Frank Sobey bought it for its land and ability to be transformed into an investment company. 1947 was also the year Sobeys opened its first supermarket store in Pictou. It was on the eve of Sobeys' 100th anniversary celebration of JW's birthday (JW was originally a marketer of meats) that Sobeys purchased Empire Company outright, acquiring the 27.9% of shares it didn't already own for $1.06B on April 26, 2007 for $58/share ($2-4 premium over the fair market value). In the fourth quarter of fiscal 2011 sobeys attributed the drop of 13.8% in sales from other operations to lower box office attendance due to movies having less consumer appeal. In the discount food market FreschCo is a new invention by Sobeys aimed squarely at Loblaws' No Frills ($3.4B in revenue or about 11% of Loblaw Companies annual sales). No Frills has been in business since 1978. Only about 12% of the grocer market in the maritimes is in the discount market, that's in stark contrast to Ontario (45%) and Quebec (33%). No Frills sold $3.4B worth of goods in Ontario alone in 2010 more than its two main competitors combined. (June edition: Grocery Trade Review)

In 2011 Sobeys expanded 12 stores (down from 13 in 2010/11 in 2009), opened 44 (up from 41 in 2010/47 in 2009) and closed 39 locations (down from 52 in 2010). Sobeys went private in 2007 when it became a subsidiary of Empire Company Limited following Empire's purchase of $1.06b worth of Sobeys outstanding common shares bringing its interest up to 100%. The company's 2011 revenue is 61% higher than it was in 2002 (145% increase in book value per share: 47.76).

Brand Diversification and the Ethnic Market
Sobeys has also been more open to diversification of its brands; After Metro acquired A&P it spent $200M to completely convert Loeb/A&P locations into Metro stores, however Sobeys chose a different route; After acquiring Price Choppers in the 1990's it left the brand largely intact for more than a decade before rebranding it as FreshCo, the other acquisition IGA/Oshawa Group ($1.5B deal in 1998 tripled its size and made it into a national company) was left intact. Initially, Sobeys did this in a bid to win over customers through customer appreciation efforts however brand diversification appears to have benefited Sobeys in the long run because it has allowed it to tap into different markets more effectively (Loblaws gained a bigger market share after it acquired T&T and launched No Frills and now Sobeys is doing the same with FreshCo, that chain has proven popular among ethnic customers, a consumer base that already represents over 35% of shoppers in Ontario and will represent 31% of all Canadians by 2031. (Sobeys takes on Loblaws/Weston to court discount and ethnic shoppers)
Sobeys has experienced tremendous growth over the last decade even before its recent success, between 2001 and 2006 Sobeys stock price rose by over 68%. Sobeys also has a significant stake in Canadian real estate (45.9% of Crombie real estate investment trust, 40% of Genstar Development Partnership) and with Canadian real estate prices climbing (average home price up 6.5% in September/# of properties sold up 2.7% qoq) those investments are bound to pay off for Sobeys. Crombie reit's properties include both high end assets (Barrington Place Shops, Cogswell Tower, CIBC Skyscraper in Halifax) and more traditional retail assets (Greenfield Park IGA plaza, Quebec). Sobeys also holds 100% ownership of Canada's second largest chain of movie theaters, Empire Theatres (Sobeys has operated cinemas since 1984). 2011 is also the year Sobeys converted most of its mainline locations into 24 hour supermarkets taking away from Superstore a key competitive advantage. About 85% of Empire's assets are associated with the food retailing business. Sobeys first reached $1 billion in sales in 1987, in 1999 (2000 fiscal year) Empire-Sobeys sales surpassed $10 billion for the first time (reflecting the first full year the Oshawa Group was part of it). Although revenue increased 75% that year, net income fell 35.7% to $86.7m.

Agreement With Target Canada Gives Sobeys Deeper Market Access
    On September 23, 2011 Target Canada announced that an agreement had been reached with Sobeys in which Sobeys will become the primary supplier of grocery items. The deal is big for Sobeys because it will be able to sell its own private label items outside of its own locations of Sobeys, FreschCo, IGA, etc. A similar agreement made in the US between Target and SuperValu Inc significantly boosted SuperValu's revenue and market access (operates over 2,500 locations but that number nearly doubles when Target and other stores it serves as primary distributor are included). 125-135 Target locations are slated to open begining in 2013. Since the news broke about a month ago Sobey's stock is up 6.2%. In the discount supermarket sector Sobeys' FreschCo competes directly with Loblaw's No Frills throughout much of Canada (though FreshCo hasn't yet been introduced to key areas such as Halifax), while Superstore (Real Canadian or Atlantic depending on the region, the superstore brand represents 1/5th of Loblaw's corporate run locations), Provigo (taken over in 1998/1999, presently Provigo is the largest brand by locations, 2X as many as Superstore), Maxi. Great Food and Zehr's take on Sobeys, IGA and Foodland head to head in regular priced food retailing in central and eastern Canada. About 30% (<400) of all Loblaw locations are discount 'no-frills' (removal of non-essential items to keep prices low) grocery stores (no-frills/valuemart/freshmart/wholesale club), that compares to less than 20% (252) for Sobeys' thrifty foods/freshco. No Frills sold $3.4B worth of goods in Ontario alone in 2010. (June edition: Grocery Trade Review)

On November 15, 2011 announced that it had reached a deal with the National Bank of Canada involving the sale of 15,000 tonnes worth of CO2 greenhouse gas emission gas credits (annually) to the bank, allowing the bank to be a neutral emitter (Sobeys currently has an excess of credits in Quebec due to improvements at IGA locations where harmful refrigeration gasses have been replaced).
Stats from the last two reported quarters
Empire-Sobeys - Fiscal 1q12 & 4q11: revenue was $8.3415 billion up 6.1% from the 1q11 & 4q10 ($7.8585), ebitda $512.8m up 6.3% from $485.8m, profit $171.7m up 7.5% from $159.8m.
Loblaw Companies - Fiscal 2q11 & 3q11: revenue was $16.841b up 1.2% from 2q10 & 3q10 ($16.646), ebitda $1143m up 7% from $1068m, profit $433m up 14.6% from $378m.
Metro Inc. - Fiscal 3q11 & 4q11: revenue was $6.233b up 1.8% ($11.4306b up 0.8% for the fiscal year)
ebitda $420.7 million down 2.9% ($773.4m up 6.8% for the year) with net earnings of $211m down 1.1% ($386.3m up 3.4% for the year).

For Empire-Sobeys, food retailing made up 98% of sales and 90% of operating income in both 2011 & 2010. The commercial real estate business contributes about 30% of funds from real estate operations even though it only contributes less than 15% of real estate revenue. Food Retailing: net debt/net total capital ratio was at its lowest level in 2011, hitting 13.4% it was as high as 32% just three years ago (2008). There are about 286 standalone Sobeys locations across Canada (25% of the company's locations). In fiscal 2011 57 freschco stores were opened, which exceeds units opened by main competitor No Frills. In 2005 it acquired the Oshawa Group, owner of IGA Canada. In March 2002 Sobeys sold Serca Foodservice to SYSCO for $411M.

Sobeys sells Wajax Income Fund but Maintains Interest in Halifax property owner Crombie Reit
->Since March 2006 Sobeys sold 105 properties to Crombie REIT raising $897m in 2 transactions.
->In 2010 Sobeys lowered its debt to capital ratio from 32.7% down to 29.3% and consequently (in May) both Standard & Poor's and DBRS raised Sobeys credit rating.
->In 2011 Sobeys divested itself of Wajax stock by selling 27.5% of Wajax Income Fund for $121.3m (used the proceeds to pay down debt). The market value of all of its real estate investment holdings was $451.2m on May 7, 2011 compared to $487.7m a year earlier (decrease was entirely due to the divestment of its Wajax investment which was worth $117.9m in 2010).
->During fiscal 2010 food retailing/real estate represented 94% of net income. At the end of 2010 total locations (food retailing) under the various banners numbered 1,334 (28.1m square feet) in 836 communities. In 2011 free cash flow fell to $132.6m from 350.1M.