Interesting Facts
- The China-Brazil trade corridoor had a compound annual growth rate of 30% during the last decade.
- China accounts for 18% of Brazil's total trade, up from 4% in 2000.
- HSBC has only been in Brazil since 1997 but it is already a significant contributor to the country's economy. HSBC now finances 6% of the Latin American country's foreign trade.
- Using current dollars, median household income in British Columbia, Canada is $68,000 today, down from $72,000 in 1971. (source: CBC) What's alarming about that is the fact that the average home price was only $272,000 which is a lot lower than today's $806,000.
- On November 29, 2011 JP Morgan sold 198.143 million shares of HSBC Holdings stock (1.11% interest in the company) for HK$58.83 a share. That reduced JP Morgan's interest in HSBC to 6.35% down from 7.46%
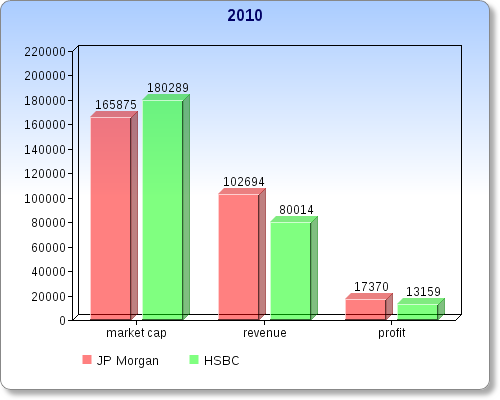
In 2011, the bank ranked first in terms of global investment banking fees. Though profit was down -22.9% over the last quarter of 2011, total annual profit for the year reached a record high of $19 billion +9.2% vs 2010; Net income per share improved even more, +13.1% to $4.48. During the fourth quarter, non-performing assets fell -33%. Also in the fourth, the bank repurchased $950 million worth of common stock, bringing the total repurchased on the year to $2.9 billion. It's important to remember that, even though JP Morgan has the highest market cap among the top banks (outside China) it remains smaller than Bank of America in terms of employees (260,000 vs 300,000) and revenue ($97.234b vs $115.0b).
What tells me the bank's business is a lot healthier today than last year is the charge-off's vs credit loans; Credit sales volume +10% on the year while consequently net-charge off's happened at the lower rate of 3.93% (down from 4.34%). Deposits are now at $1.1 trillion, +21%. JPMorgan's Investment Bank's provision for credit card losses was up to $272 million at the end of last quarter which compares nicely to the loss of $271 million last year and +54 million in the previous quarter (3Q2011). However it must be noted that, the increased provisions for credit card losses on the year caused net income for the investment bank division to fall by 52% to $726 million.
The commercial banking unit experienced a 21% increase in profit (to $643 million) on record net revenue. Net charge offs down from $286 million to $99 million.
HSBC
Market capitalization down significantly to $136 billion from $180 billion (end 2010) and $199 billion (end 2009). In fact, by the end of the the 2011 calendar year, Wells Fargo pulled ahead of HSBC in terms of market cap (Wells Fargo finished 26 overall, in front of HSBC at 28). Since the financial crisis of 2006-2007, over the last four years HSBC paid out more dividends than any other FTSE100 listed bank except one (US$27.2 billion/ $7.3b in 2011 alone). Dividends were up +14% in 2011. HSBC's costs +10% in 2011 due to, among other things, wage inflation (a new bank fee charged to it by the UK government in the amount of $570m. Underlying costs now account for 61% of revenue up from 55% in 2010). North American operations accounted for only 0.5% ($100m) of HSBC's profit before tax (compared to 2.4% = $454m in 2010).
North American business has become a bit more risky as it now accounts for 22.8% of the company's risk-weighted assets ($337.3m, up from $330.7m in 2010) even though the region represents only 19.7% of total assets ($504m out of $2555.6m). Many of the bank's key financial metrics were up on the year, however there were a couple that weren't; Down were: Underlying profit before taxation: -6% to $17.696 billion, total loans and advancements -2% to $940 million. Good decreases: Ratio of loan impairment chargest to total operating income down to 13.8% from 16.9% in 2010 and 31.7% in 2009.
Showing posts with label gold investing. Show all posts
Monday, March 19, 2012
HSBC and JP Morgan record strong results in 2011 but stock market valuation still waning
Labels:
2011,
2012,
banks,
financial institutions,
financial stocks,
global banking,
gold investing,
HSBC,
HSBC revenue,
jp morgan,
JP Morgan competition,
largest banks
Thursday, August 11, 2011
Even Amidst Record Breaking Gold Prices, Not All Gold Investments Are Good Investments
On August 11, 2011 it was announced that four Ireland-based gold funds (London Aliquot Commodity, Agriculture, Precious Metals and Intelligent Portfolio Asset Allocation, operating under Castlestone Investments of London) will be terminated, with the parent company blaming the volatile economic environment since 2008 for their demise. (Gold and commodities bull run fails to avoid $50m funds' closure)
It is alleged that inconsistent financial returns have kept them from maintaining solvency on their own (they required consistent cash from the parent company); combined, they have allocated holdings worth $50 million (in gold stocks) which is relatively small but significant for its handful of investors. This comes a month after the Financial Services Authority used search warrants to conduct an investigation into Castestone's business, suggesting that mismanagement and other flawed business practices are to blame.
The funds account for 13% of Castlestone's total assets under management (total without the 4 funds is $330 million/£205 million).
In other news on the day (Thursday August 11, 2011):
Italy and France joined Greece, South Korea and a growing list of other countries in banning short selling (borrowing stocks/securities/assets from a broker, selling them to another group with the intent of returning them to the broker some time later after buying them back at a different price) after it was rumored that short sellers were trying to exploit a French downgrade. A Europe-wide ban is unlikely given the EU's lack of authority to enforce it. Turkey has also curbed short selling.
Canada's trade deficit rises to $1.6 billion in June (all countries) or $5.2 billion with countries other than the United States (US-Canada trade surplus is at $3.63 billion down from $3.73 billion in May), making it even harder for the country to lessen its reliance on trade with the USA (in the USA, the trade deficit was $53.1 billion in June up 4.4%, the highest since October 2008). For Canada, both imports and exports fell but exports fell by a wider margin. In May, Canada's trade deficit was only C$814 million (US$840 million).
It is alleged that inconsistent financial returns have kept them from maintaining solvency on their own (they required consistent cash from the parent company); combined, they have allocated holdings worth $50 million (in gold stocks) which is relatively small but significant for its handful of investors. This comes a month after the Financial Services Authority used search warrants to conduct an investigation into Castestone's business, suggesting that mismanagement and other flawed business practices are to blame.
So you see, even in bulls markets where the one main factor influencing valuations (the price of gold) is skyrocketing, investors are not always guaranteed a safe haven for their money. Due dilligance is one of the most important aspects of investing. Funds closing during the gold rush is ludicrous however that doesn't mean every fund is going to experience gains of mammoth proportion: many gold stocks haven't risen much (so far) during the commodity boom (Gold related equity funds in Canada haven't experienced the type of rise one would expect, though some stocks like Yamana Gold are up, Yamana up over 13% in July); Some base metals stocks like Taseko Mines (copper) have declined at an out of control rate; reasons for that include a market still overrepresented by people skeptical of the West's approach to its debt problems, they remain unconvinced that the United States has avoided a future default. The government of Canada has also been a problem for many companies, in November 2010 it declined to grant Taseko Mines a key mine license citing environmental effets. (globeandmail: Gold-related equity funds left in bullion’s dust)
The funds account for 13% of Castlestone's total assets under management (total without the 4 funds is $330 million/£205 million).
In other news on the day (Thursday August 11, 2011):
Italy and France joined Greece, South Korea and a growing list of other countries in banning short selling (borrowing stocks/securities/assets from a broker, selling them to another group with the intent of returning them to the broker some time later after buying them back at a different price) after it was rumored that short sellers were trying to exploit a French downgrade. A Europe-wide ban is unlikely given the EU's lack of authority to enforce it. Turkey has also curbed short selling.
Canada's trade deficit rises to $1.6 billion in June (all countries) or $5.2 billion with countries other than the United States (US-Canada trade surplus is at $3.63 billion down from $3.73 billion in May), making it even harder for the country to lessen its reliance on trade with the USA (in the USA, the trade deficit was $53.1 billion in June up 4.4%, the highest since October 2008). For Canada, both imports and exports fell but exports fell by a wider margin. In May, Canada's trade deficit was only C$814 million (US$840 million).
Labels:
Aliquot Commodity,
bull market,
castlestone,
commodities,
gold funds,
gold investing,
gold stocks,
ireland,
london,
mismanagement,
Portfolio,
short selling,
smart investing,
solvency
Monday, July 25, 2011
Performance of Gold Mining Stocks not Necessarily Correlated with the Price of Gold (last 2 months gold price is up over 14% but a basket of large/mid cap gold stocks is down 7%)
Gold stocks have decreased in value by about 7% over the last 2 months even though the price of gold has risen 14%. (Maison Placements Canada Inc.) Goldcorp and Kinross Gold both fell 4% in July 2011 even though the price of gold increased 14% (in Canada the S&P gold index only increased 8% during that time even though it hit a near term low prior to that). (globeandmail: Gold stocks still lag surging bullion price) Gold companies are playing catchup for a number reasons; Many of the established companies have dwindling reserves (annual production exceeds reserve replacement) which is one of the reasons behind declining global output (China is one of only a handful of countries that can be relied on for growth); Prior to the more recent spike in the price of gold (before 2009) gold production worldwide fell each year, from 2005 to 2009 consecutively meaning that record high gold prices are needed just to keep production steady (higher gold prices make new mine production easier to accomplish because cash costs don't need to be low for healthy margins to be realized) (Goldsheet - Historical World Gold Production) Over the long term, production has also been down in the established mining districts of South Africa and Canada. (Gold News:Gold Mining Decline) In September 2010 all of the world's gold stocks had a combined market value of US$ 360 billion, that compares to US$ 19 billion in 2000 (increase is due mostly to new mining companies entering the market; higher gold prices make even the highest cash cost operations economically viable).
There is optimism regarding production though. In Australia, Olympic Dam (BHP Billiton's trillion dollar gold/copper/silver project), Super Pit, Newcrest Mining's Cadia Hill (33 million oz of gold reserves) are well on their way to producing in the near future while in other countries that have exhibited falling production rates in the 2000's (Canada specifically), new projects at Detour Lake, Malartic, Kerr-Sulphurets Mitchell and Snowfield/Bruceback (88 exploration projects in British Columbia alone in 2010 with capex spending the sixth highest since 1991) have investors optimistic. (Mineweb: Officials believe one of the largest gold resources in the world lies within BC) Canada's biggest gold project, Kerr-Sulphurets-Mitchell (reserves at 39 million ounces for gold and 214 million ounces for silver) is estimated to have cash costs of only $105 for the first seven years, that's four times less than Goldcorp's cash cost which has the lowest among tier 1 gold companies; also four times lower than Yamana Gold's cash costs !
Some interesting facts about gold: 3/4 of all the gold ever extracted from the earth was mined after 1910. South Africa was the largest producer in most years since that time. Switzerland was the last country to tie its currency to the price of gold (1999). Until May 2009, all the gold ever extracted amounted to 5,835,876,025.6 ounces or about 85% of an ounce per person (165,446 tonnes). Gold weighs 19.3 times as much as water, is even more rare than diamonds, never oxidizes (maintains its shine), and in its more natural form, is one of the softest metals. Web Directories
There is optimism regarding production though. In Australia, Olympic Dam (BHP Billiton's trillion dollar gold/copper/silver project), Super Pit, Newcrest Mining's Cadia Hill (33 million oz of gold reserves) are well on their way to producing in the near future while in other countries that have exhibited falling production rates in the 2000's (Canada specifically), new projects at Detour Lake, Malartic, Kerr-Sulphurets Mitchell and Snowfield/Bruceback (88 exploration projects in British Columbia alone in 2010 with capex spending the sixth highest since 1991) have investors optimistic. (Mineweb: Officials believe one of the largest gold resources in the world lies within BC) Canada's biggest gold project, Kerr-Sulphurets-Mitchell (reserves at 39 million ounces for gold and 214 million ounces for silver) is estimated to have cash costs of only $105 for the first seven years, that's four times less than Goldcorp's cash cost which has the lowest among tier 1 gold companies; also four times lower than Yamana Gold's cash costs !
The reason for the 7% drop in gold stocks at a time when gold prices increased by double digits (%) is simple: Companies with declining reserves are looking to mine in high cash cost regions out of desperation (higher cash cost=smaller margins=market value of each ounce goes down). Newmont Mining is an example; though reserves have maintained growth the increases have been smaller [only about 1.6% growth in 2P reserves in 2010, 93.5 million from 92 million ounces versus 7 million between 2008 and 2009 (85 mil in 2008/92 mil in 2009], established companies like AngloGold and Goldfields have decreasing production rates while other companies like Kinross Gold have taken on lots of debt to make questionable acquisitions (by issuing paper, other examples are Barrick Gold's acquisition of Equinox Minerals). Smaller potential for cash cost improvements/production rates by established companies means the junior, relatively new players (like Eldorado Gold, Detour Gold, Osisko Mining) and others like Yamana Gold (undervalued because of past risks which have proven to be not a problem for the company, Yamana was up 13% in the month of July, being one of the only major gold players to record significant growth over that time (Newmont was flat while Barrick Gold was only 3.5% higher, Goldcorp and Kinross were flat) is where the highest growth rates (PEG Ratio, P/E ratio) will come from. In 2008 though, things were different; For most of 2008 when gold prices started their overall upward trend, it was the large cap companies that outperformed the small cap; the opposite was true in the summer of 2011 when gold prices broke through new levels, the change in behavior might simply be the result of a much higher support level for gold prices making high production costs less of an issue for startup companies (many more juniors entered the market in 2011 than in 2008). Goldcorp's largest gold producing mine Red Lake, is nearing the end of its mine life (about 700,000 ounces/year gone), but Goldcorp production will be maintained due to many other mines commencing (Penasquito, Mexico reached commercial production in late 2010; Pueblo Viejo, Dominican Republic; Cerro Del Negro, Argentina).Another thing to consider is that there are some factors unrelated to stocks, which affect spot prices; For example in early August of 2011 (when there was a lot of economic uncertainty) gold and silver spot prices declined at the same time major stock indices fell by their largest margin since the 2008 recession, the commodities selloff was sparked by a margin call (temporary selloff due to traders being required to meet call options). On August 8, 2011 when stocks performed poorly, gold spiked again (gold is the first thing central banks/banks/investors hoard when they want a stable investment medium, also when banks realize they might have to fulfill their significant short positions) but don't be concerned about the more gradual silver increase (historically, silver has lagged gold (time) when increases occur; the reason is that banks and large investors tend to wait until gold gets too expensive before buying the white metal); also, when gold becomes more costly, jewelers and industrials turn to alternatives and silver is one of them. Also consider the gold/silver ratio which is 44 (August 8, 2011), much higher than the historic ratio of under 20.
Some interesting facts about gold: 3/4 of all the gold ever extracted from the earth was mined after 1910. South Africa was the largest producer in most years since that time. Switzerland was the last country to tie its currency to the price of gold (1999). Until May 2009, all the gold ever extracted amounted to 5,835,876,025.6 ounces or about 85% of an ounce per person (165,446 tonnes). Gold weighs 19.3 times as much as water, is even more rare than diamonds, never oxidizes (maintains its shine), and in its more natural form, is one of the softest metals. Web Directories
Labels:
Australia,
Canada,
cash cost,
China,
decreasing production,
Eldorado,
gold investing,
gold price,
gold reserves,
gold stocks,
Goldcorp,
investing,
Juniors,
Newmont,
Olympic Dam,
production,
Red Lake,
silver stocks
Subscribe to:
Posts (Atom)


